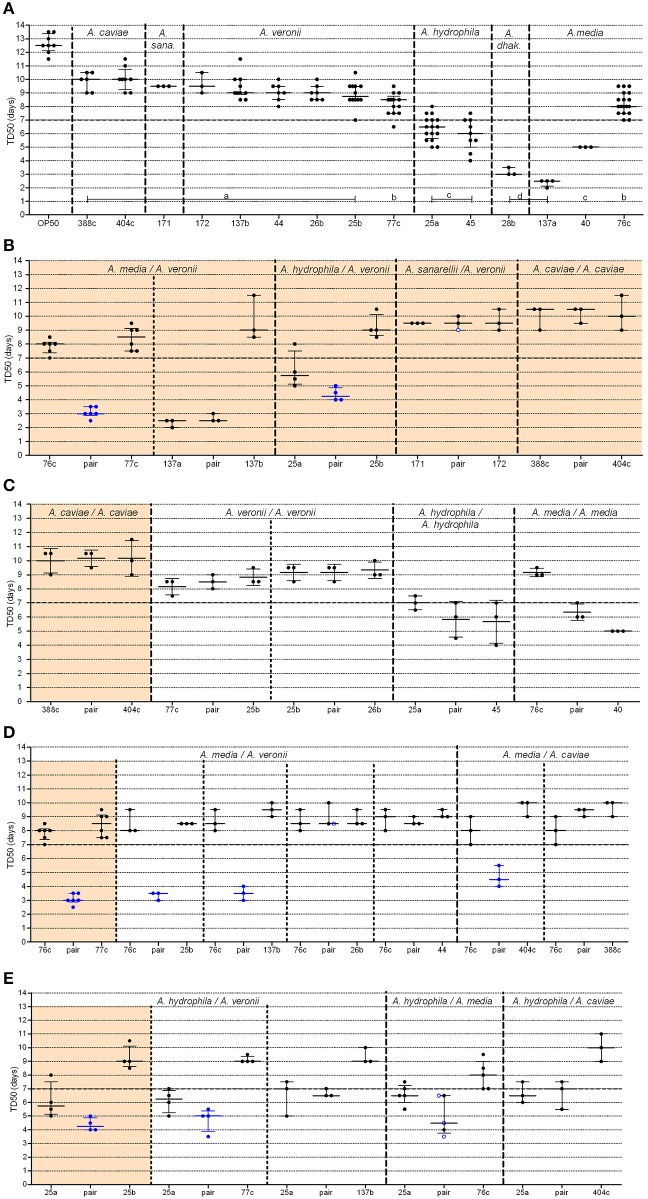
Figure 2.
Graphical representation of median time to worm death (TD50) obtained from strains administered alone or in pairs. For clarity, the BVH, CAH, and ADV strain naming prefixes have been omitted. (A) Single strains (A. dhak: A. dhakensis; A. sana: A. sanarelli); (B–E) Strains in pairs, including: (B) natural pairs; (C) experimental pairs with strains belonging to the same species; (D,E) experimental pairs with strains from distinct species including either strain 76c (D) or strain BVH25a (E). Each point represents the TD50 from one experiment and bars indicate the corresponding medians and interquartile ranges (IQR) of the TD50s. (A) Shows the plots (TD50) for each single strain that were obtained in all experiments. Light orange background sections correspond to data from natural pairs (i.e., both were recovered from a single clinical sample). Every section corresponds to pairs and single strains performed within the same assays to limit experimental variation. Mann-Whitney tests [or Kruskal-Wallis tests for data from (A)] with Bonferroni's correction were used for TD50s analysis. Log-rank tests with Bonferroni's correction were used for survival curves, as detailed in Supplemental Table 2. A P-value < 0.05 indicated that data were significantly different from each other. Single strain aeromonads (A) with significantly different TD50 values from each other are indicated by lowercase letters (A, a–d), and the corresponding statistics are detailed in Supplemental Table 1. Blue points (B–E) indicate pairs with (i) a shortened TD50 compared to both of the TD50 values of the corresponding single strains and (ii) shorter survival curves compared to both of the curves of the corresponding single strains. Black points indicate pairs with no difference both (i) in TD50 and (ii) in survival curves with the values of the corresponding single strains. Blue ringed white points indicate pairs (i) with shorter survival curves compared to both of the curves of the single strains but (ii) with no difference in TD50s compared to both of the TD50 values of the corresponding single strains.

