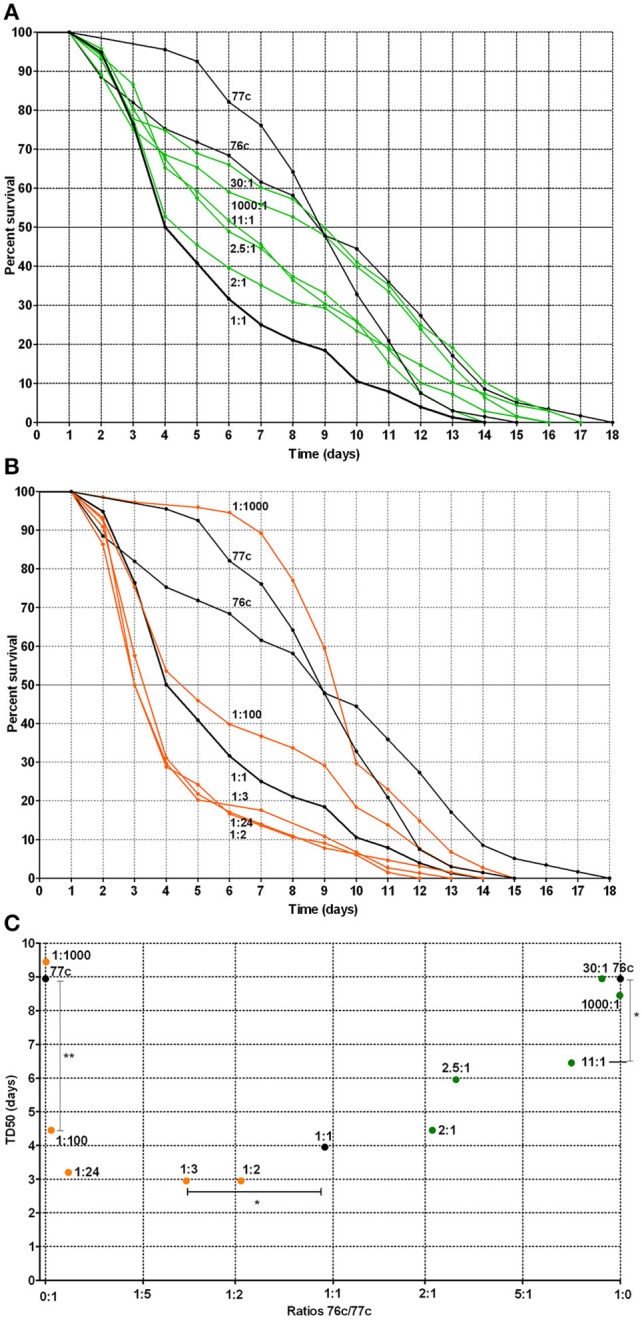
Figure 4.

Worm survival according to mixed infection with strains 76c and 77c at varying inoculum ratios (ratios from 1:1000 to 1000:1, with 76c and 77c being presented as the first and second strain of the ratio, respectively). (A) Orange curves correspond to worm survival curves for strains in which 77c prevailed (ratios from 1:2 to 1:1000). Black curves (1:0, 0:1, and 1:1) correspond to worm survival curves for the single strains 76c and 77c and for mixes in which strains 76c and 77c were included at equal density, respectively. (B) Green curves correspond to worm survival curves for mixes in which strain 76c prevailed (ratios from 2:1 to 1000:1). Black curves (1:0, 0:1, and 1:1) correspond to worm survival curves for the single strains 76c and 77c and for mixes containing strains 76c and 77c in equal density, respectively. (C) Median time of worm death (TD50), according to the relative frequency of 76c within the mix. The statistical analysis performed was log-rank tests with Bonferroni's correction. A P-value < 0.05 indicated that survival curves were significantly different from each other, as presented in Supplemental Table 2. *Indicates a P-value between 0.01 and 0.05; ** indicates a P-value between 0.001 and 0.009.
