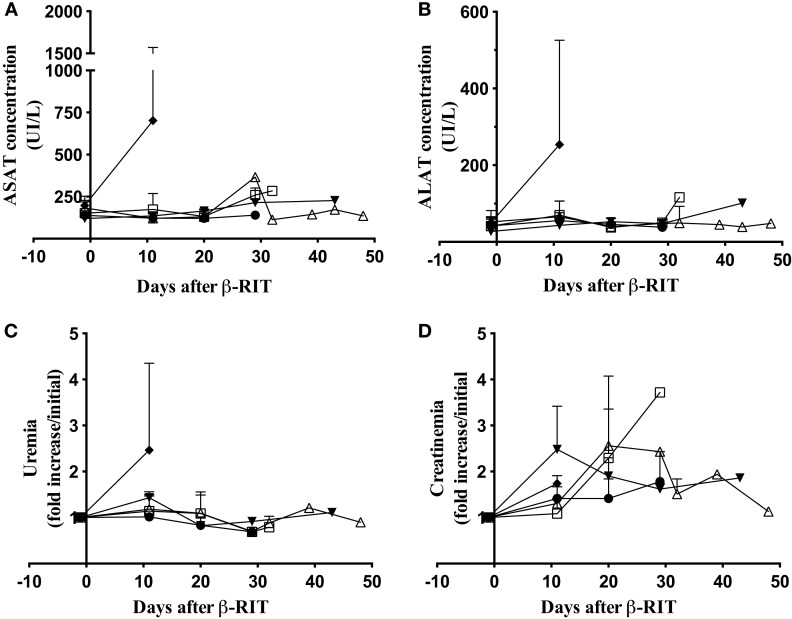
Figure 7.
Hepatic and kidney toxicity after β-RIT. (A) ASAT, (B) ALAT, (C) urea, and (D) Creatinin concentrations were measured in pooled plasma from mice in the control group (●) or after β-RIT at 3.7 MBq (□), 18.5 MBq (△), 27.75 MBq (▼), or 37 MBq (♦). Results are expressed as mean ± SD. Data represent pooled plasma from three independent experiments.

