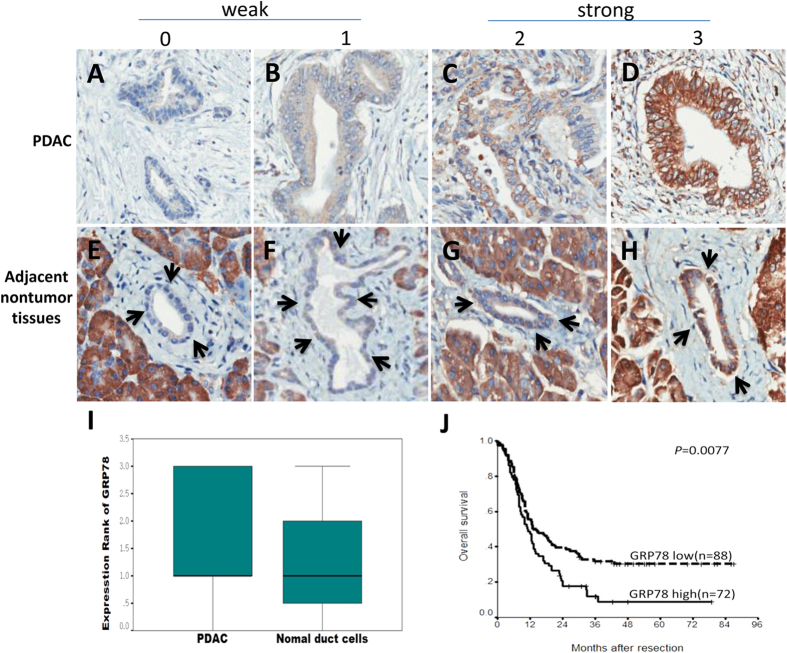
Figure 1. Immunohistochemical staining of GRP78 and the Kaplan-Meier survival analysis.
(A–D) Different staining intensities of GRP78 in the PDAC tumor tissues. (E-H) Different staining intensities of GRP78 in the adjacent nontumor tissues. The cellular staining was classified using a scale of 0-3 as follows: 0 = negative (A, E), 1 = weakly positive (B,F), 2 = moderately positive (C,G) and 3 = strongly positive (D,H) (original magnification 200×). (I) Comparison of the GRP78 staining score between the PDAC and nontumor pancreatic duct cells (Mann–Whitney U-test, p = 0.009). (J) Survival analysis of the PDAC patients after surgical resection based on the GRP78 expression in the tumor tissues (log-rank test, p = 0.0077).

