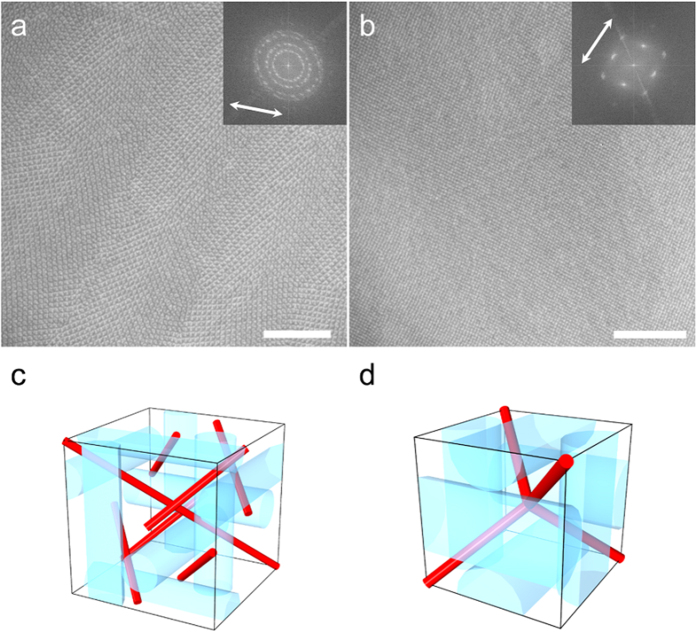
Figure 5. Wide-field TEM images and schematic illustration of disclination lines BPs I and II.
(a) Wide-field TEM image of quenched BP I and corresponding FFT pattern. (b) Wide-field TEM image of quenched BP II and corresponding FFT pattern. Arrows indicate the direction of orientational rubbing. Scale bars, 3 μm. (c) Unit cell of BP I with the 7 independent disclination lines shown in red. (d) Unit cell of BP II with the disclination network shown in red.

