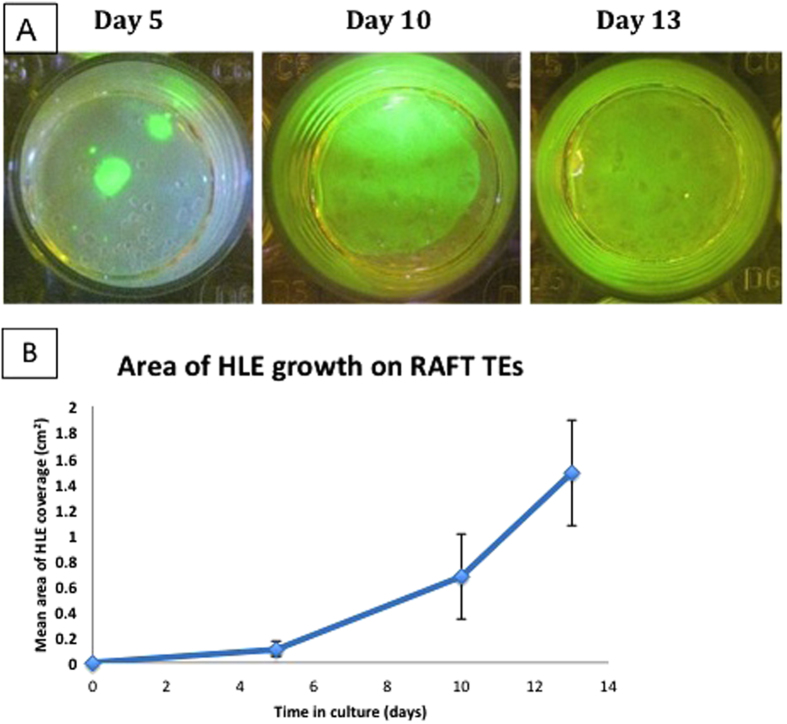
Figure 2.
(a) Photographs of fluorescein diacetate (FdA)-stained RAFT TEs with mixed population of CSSC and HLE on surface. Images are taken with a camera using a yellow lens under a blue light. HLE growth (seen in green) increases over time in culture until a confluent monolayer is achieved by day 13. (b) Graph illustrating mean area of HLE growth (n = 4 donors) over 13 days of culture. RAFT TEs were stained with FdA and images taken at different time points during culture. Each point represents a mean value taken from the average of 4 biological donors (i.e. 4 RAFT TEs per donor).

