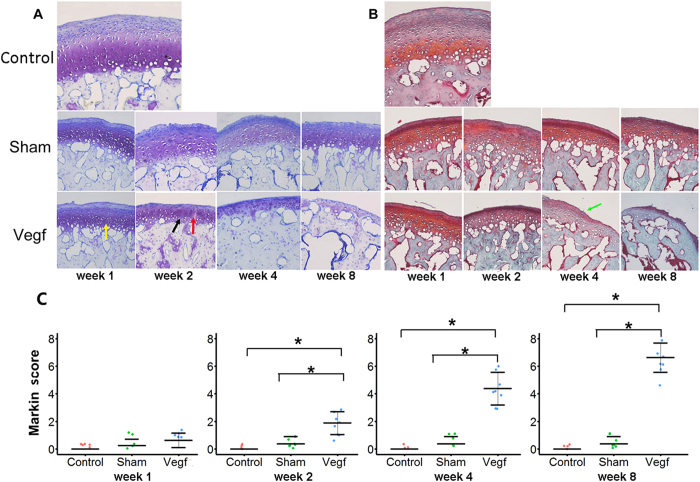
Figure 2. Degenerative changes in the condyle cartilage in the control, sham, and vegf groups at weeks 1, 2, 4, and 8.
(A) Proteoglycan changes in the condyle observed with toluidine blue. (B) Safranin-O and fast green staining (×200). Gradual but pronounced proteoglycan loss is observed in the vegf group over time. Additionally, irregular arrangement of chondrocytes (yellow arrow), chondrocyte clusters (black arrow), an increase in the cell free area (red arrow), and fibrillation (green arrow) are only observed in the vegf group. (C) Comparison of the Mankin scores between the groups. The Mankin scores are significantly higher in the vegf group than in the sham and control groups from week 2 onwards (*P < 0.05).

