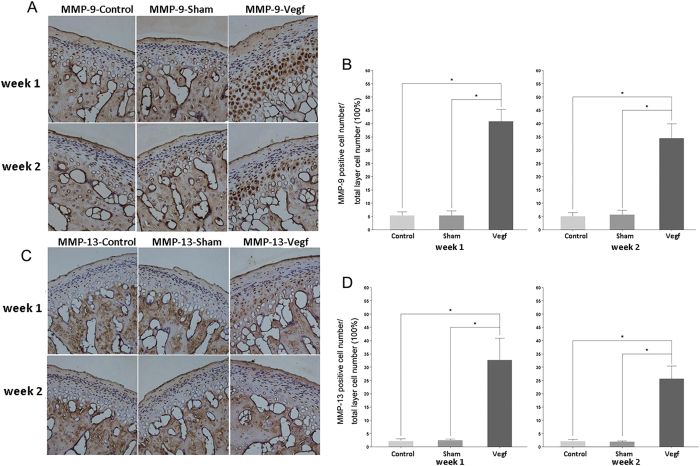
Figure 3. Expressions of MMP-9 and MMP-13 in the control, sham, and vegf groups at weeks 1 and 2.
(A,C) Immunohistochemical staining for MMP-9 (A) and MMP-13 (C) at weeks 1 and 2. High numbers of MMP-9- and MMP-13-positive cells are observed in the vegf group. (B,D) Comparison of the percentages of MMP-9- (B) and MMP-13-positive cells (D) between the groups. The percentages of MMP-9- and MMP-13-positive cells are significantly higher in the vegf group than in the control and sham groups (*P < 0.05).

