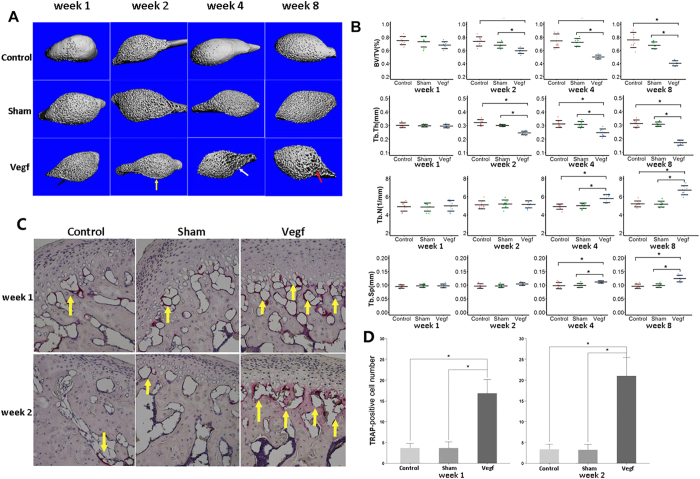
Figure 5. Subchondral bone destruction and resorption in the control, sham, and vegf groups at weeks 1, 2, 4, and 8.
(A) Three-dimensional images of the temporomandibular joint condyle. Subchondral bone lesions are seen in the vegf group at weeks 1 and 2 (black and yellow arrows, respectively), while bone lesions accompanied with local sclerosis are seen in the vegf group at weeks 4 and 8 (white and red arrows, respectively). (B) Comparison of subchondral bone features using micro-CT scanning. The bone volume fraction (BV/TV) and trabecular thickness (Tb.Th) are significantly lower in the vegf group than in the control and sham groups from week 2 onwards, and the trabecular number (Tb.N) and trabecular separation (Tb.Sp) are significantly higher in the vegf group than in the control and sham groups from week 4 onwards (*P < 0.05). (C) A high number of tartrate-resistant acid phosphatase (TRAP)-positive osteoclasts is seen in the vegf group (yellow arrows). (D) Comparison of the number of TRAP-positive osteoclasts. The number of TRAP-positive osteoclasts is significantly higher in the vegf group than in the control and sham groups (*P < 0.05).

