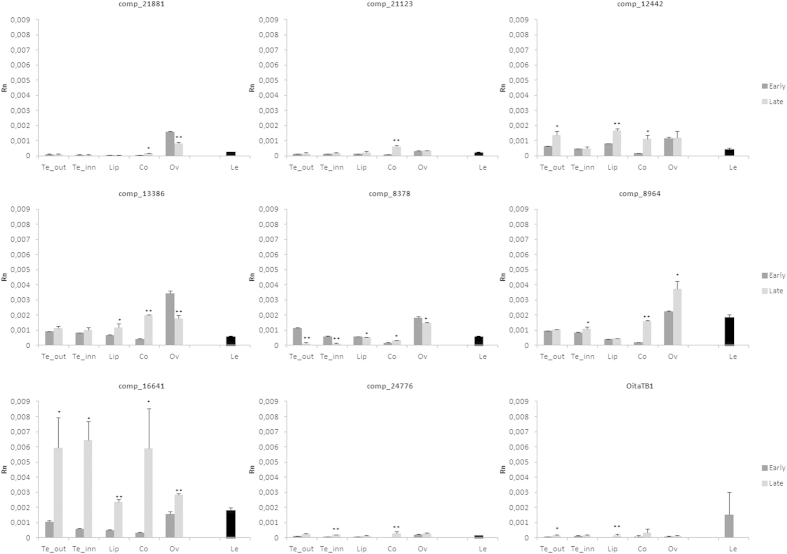
Figure 5.
The relative expression of nine TCP transcripts in different floral tissues and in leaves of O. italica. The bars indicate standard deviation. The asterisks indicate statistically significant differences between the relative expression of the early and the late stages (*p < 0.05, **p < 0.01). Te_out, outer tepals; Te_inn, inner tepals; Lip, labellum; Co, column; Ov, ovary; Le, leaf. Rn, relative normalized expression.

