
Figure 1. Fold change of the frequencies of prophage excision in E. coli K-12.
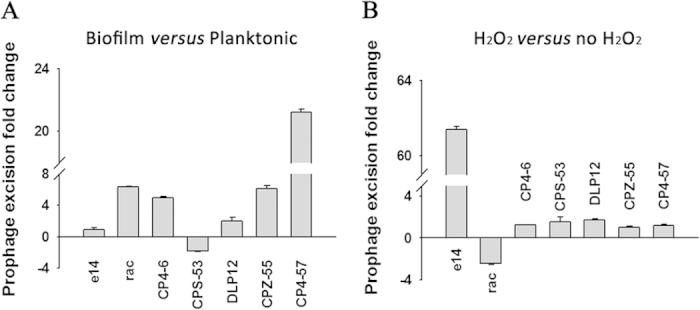
(A) Fold change of excision of seven prophages in biofilm cells versus planktonic cells at 48 h in E. coli K-12. (B) Fold change of excision of seven prophages with oxidative stress (2 mM H2O2) versus without oxidative stress in E. coli K-12. H2O2 was added to cells (OD600 ~ 1.0) for 90 min. Data are from two independent cultures and one standard deviation is shown in A and B.