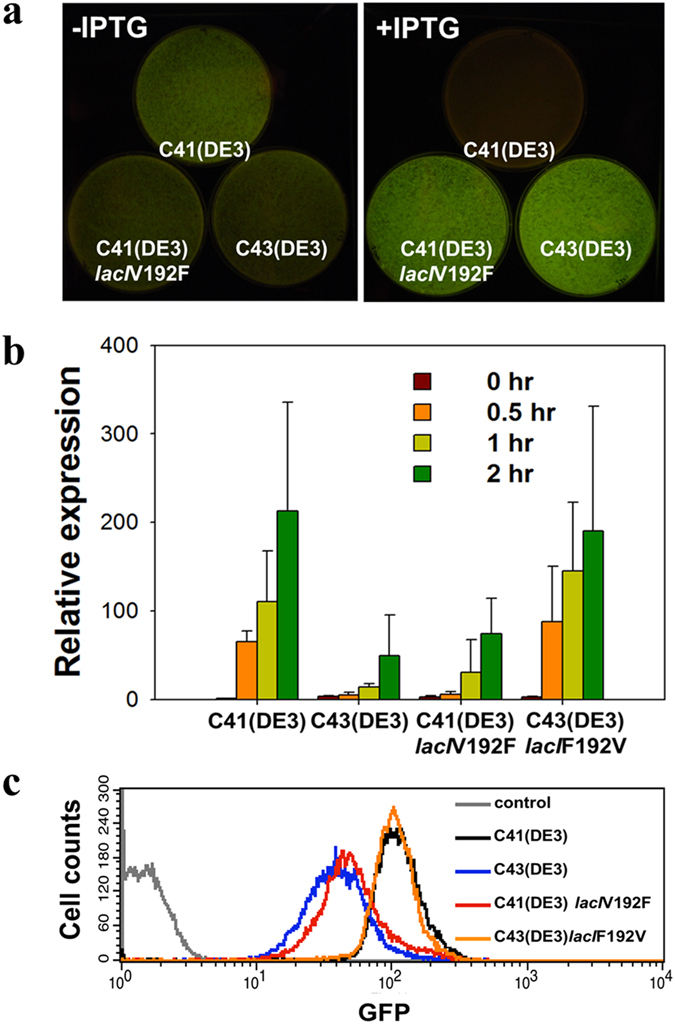
Figure 3. Expression capacity of E. coli C41(DE3), C43(DE3), C41(DE3)lacIV192F, and C43(DE3)lacIF192V to produce the E. coli F-ATPase subunit b.

(a) Phenotypic comparison of Ecb expression in C41(DE3), C43(DE3), and C41(DE3)lacIV192F in the absence (-IPTG) or presence (+IPTG) of IPTG. C41(DE3), C43(DE3), and C41(DE3)lacIV192F contained pMW7(Ecb-GFP). (b) Relative expression levels of the atpF gene in C41(DE3), C43(DE3), C41(DE3)lacIV192F, and C43(DE3)lacIF192V containing pMW7(Ecb-GFP). After IPTG induction, the cultures were collected for RNA extraction. Quantification of the mRNA expression level was performed using qRT-PCR and the comparative critical threshold (2−ΔΔCT) method (Livak and Schmittgen, 2001). The 16S rRNA gene was used as an internal control. The transcripts at the four time points (shown on top) relative to the transcript levels in C41(DE3) at 0 hr were quantified. Error bars indicate the standard deviations of triplicate reactions. (c) Flow cytometric analysis of GFP fluorescence in C41(DE3) (black), C43(DE3) (blue), C41(DE3)lacIV192F (red) and C43(DE3)lacIF192V (orange) overexpressing Ecb-GFP. After 3 hours of IPTG induction, the cells were collected for detection of GFP expression. C41(DE3) without the plasmid was used as the negative control.
