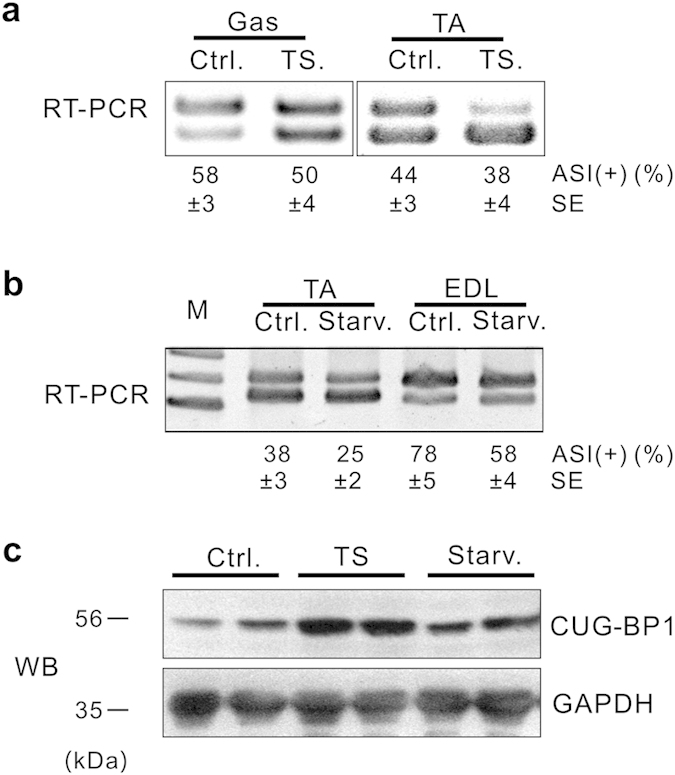
Figure 4. Alteration of CUG-BP1 and ASI proportion in TS and Star induced muscle atrophy.

(a) Proportion of ASI(+) in Gas and TA muscles from tail suspension (TS) mice was analyzed by RT-PCR. (b) Proportion of ASI(+) in TA and EDL muscles from starvation (Starv) mouse model was determinated by RT-PCR analysis. (c) Increased CUG-BP1 expression was confirmed by WB assay in TA muscle from TS or Starv mice. Data are presented as the means ± s.e.m.
