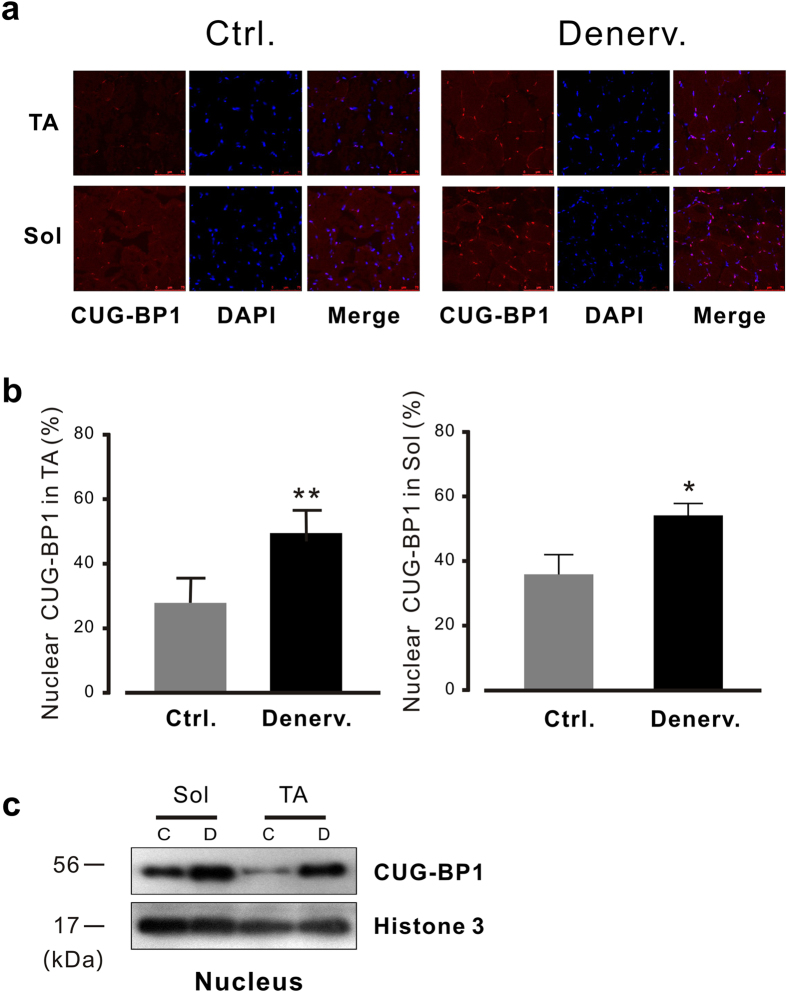
Figure 5. Subcellular distribution of CUG-BP1 in atrophied muscles.
(a) Immunofluorescence staining of CUG-BP1 from control and denervated muscle by frozen section. The localization of CUG-BP1 was determined by immunofluorescence staining. DAPI and CUG-BP1 (Alexa Fluor® 546)-stained images of a single representative field are shown and merged. (b) Summary data of Subcellular distribution of CUG-BP1. Notably, at day 7 after denervation, total muscle nuclei stained with CUG-BP1 was increased in TA (left) and in soleus muscl (right). (c) The results of western blots from subcellular fractions of muscles after denervation confirm the increase of CUG-BP1 expression in nucleus. Nuclear extracts were prepared from denervated and control TA or soleus muscle. Relative amounts of CUG-BP1 during atrophy as well as the nuclear marker Histone 3 were determined by Western blotting. Data are presented as the means ± s.e.m; *P < 0.05 and ** P < 0.01 by two-tailed Student’s test.

