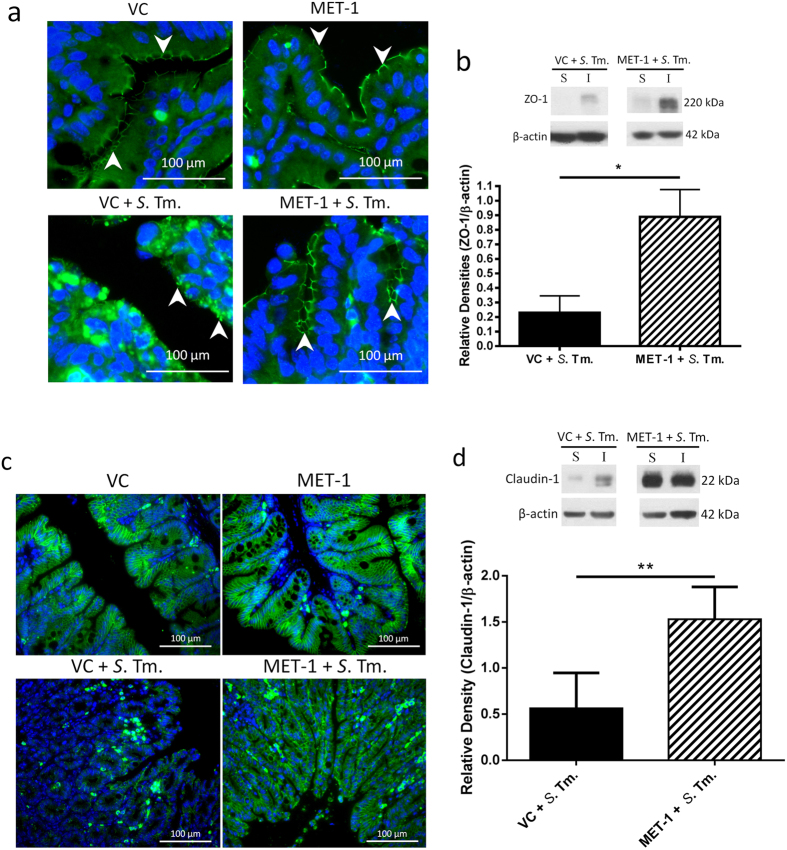
Figure 8. MET-1 pretreatment prevented the disruption of ZO-1 and claudin-1 cellular localization in the cecum caused by S. typhimurium.
(a) ZO-1 immunofluorescence staining (green) in ceca fixed in 10% formalin (400× magnification). Nuclei were stained using Hoechst (blue). White arrows indicate green staining of ZO-1 protein at the membrane of intestinal epithelial cells. VC = uninfected mice pretreated with vehicle control; MET-1 = uninfected mice pretreated with MET-1; VC + S. Tm. = S. typhimurium-infected mice pretreated with vehicle control; MET-1 + S. Tm. = S. typhimurium-infected mice pretreated with MET-1. VC + S. Tm. mice had a loss of ZO-1 membrane staining that was attenuated in MET-1 + S. Tm. mice. (b) Expression of ZO-1 measured by Western blot analysis (S, Triton X-soluble fraction; I, Triton X-insoluble fraction, sample blot shown in top right of panel). Consistent with data in panel (a), densitometric values calculated for the ratio of ZO-1 to β-actin showed that MET-1 + S. Tm. mice had increased expression of ZO-1 in insoluble fractions compared to VC + S. Tm. mice. Data were analyzed using a 1-way ANOVA with Bonferroni correction (*p < 0.05). n = 5 mice for VC + S. Tm., n = 4 for MET-1 + S. Tm. (c) Claudin-1 immunofluorescence staining (green) in ceca fixed in 10% formalin (400x magnification). Nucleic acid was stained using Hoechst (blue). VC + S. Tm. mice displayed disaggregation and clumping of epithelial claudin-1 immunofluorescence, along with discontinuities in membrane staining and a reduction in staining intensity. This alteration in claudin-1 expression was attenuated in MET-1 + S. Tm. mice. (d) Expression of claudin-1 was measured by Western blot analysis (S, Triton X-soluble fraction; I, Triton X-insoluble fraction, sample blot shown). Densitometric values were calculated for the ratio of claudin-1 to actin and showed that MET-1 + S. Tm. mice had increased expression of claudin-1 in insoluble fractions compared to VC + S. Tm. mice. Data were analyzed using a 1-way ANOVA with Bonferroni correction (**p < 0.01). n = 5 mice for VC + S. Tm., n = 4 for MET-1 + S. Tm.

