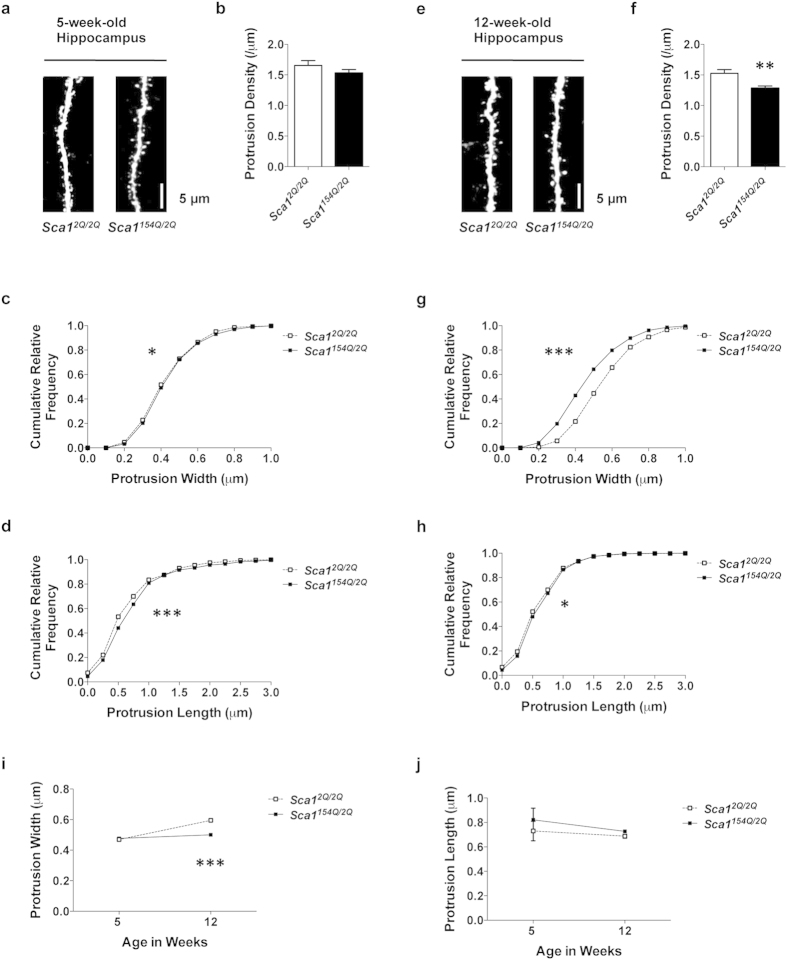
Figure 4. SCA1 mice show progressive deficits in the density and morphology of hippocampal dendritic protrusions.
(a–h) Analysis of dendrites in the hippocampal CA1 stratum radiatum of 5- (a–d) and 12-week-old (e–h) Sca12Q/2Q mice (n = 15 dendrites from three animals and n = 20 dendrites from four animals, respectively) and Sca1154Q/2Q mice (n = 15 dendrites from three animals and n = 25 dendrites from five animals, respectively). (a,e) Confocal images of dendrites in 5- and 12-week-old Sca12Q/2Q and Sca1154Q/2Q mice. Images are best projections (3–7 optical sections, 0.43 μm apart). (b,f) Dendritic protrusion density in Sca12Q/2Q and Sca1154Q/2Q mice. Sca1154Q/2Q mice showed a lower protrusion density than Sca12Q/2Q mice at 12 weeks of age. (c,g) Cumulative frequency distribution of protrusion width in Sca12Q/2Q and Sca1154Q/2Q mice. The distribution of protrusion width was abnormal in Sca1154Q/2Q mice, particularly at 12 weeks of age. (d,h) Cumulative frequency distribution of protrusion length in Sca12Q/2Q and Sca1154Q/2Q mice. The distribution of protrusion length was abnormal in Sca1154Q/2Q mice at both ages. (i) Mean protrusion width at 5 and 12 weeks of age. Sca1154Q/2Q mice had narrower protrusions than Sca12Q/2Q mice at 12 weeks of age. (j) Mean protrusion length at 5 and 12 weeks of age. Sca1154Q/2Q mice had normal protrusion lengths at both ages. Data are presented as the mean ± SEM (b,f,i,j). *p < 0.05, **p < 0.01, ***p < 0.001, Student t-test (b,f), Kolmogorov–Smirnov test (c,d,g,h), or two-way ANOVA followed by Bonferroni test (i,j). Scale bar, 5 μm.

