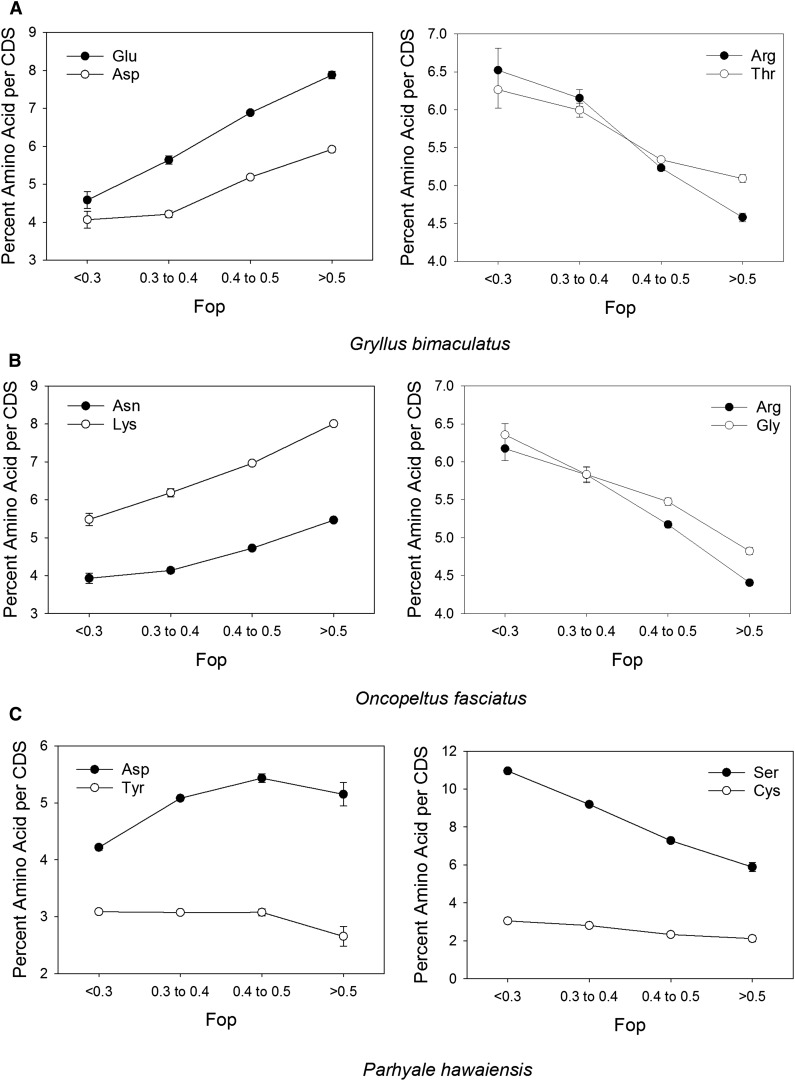
Figure 3.
The two amino acids with the largest positive (left) and negative (right) correlation to Fop/expression level in (A) G. bimaculatus; (B) O. fasciatus; and (C) P. hawaiensis. Fop was binned into four categories as shown. Spearman R correlations in Table 2 were calculated with the use of all (unbinned) data points.

