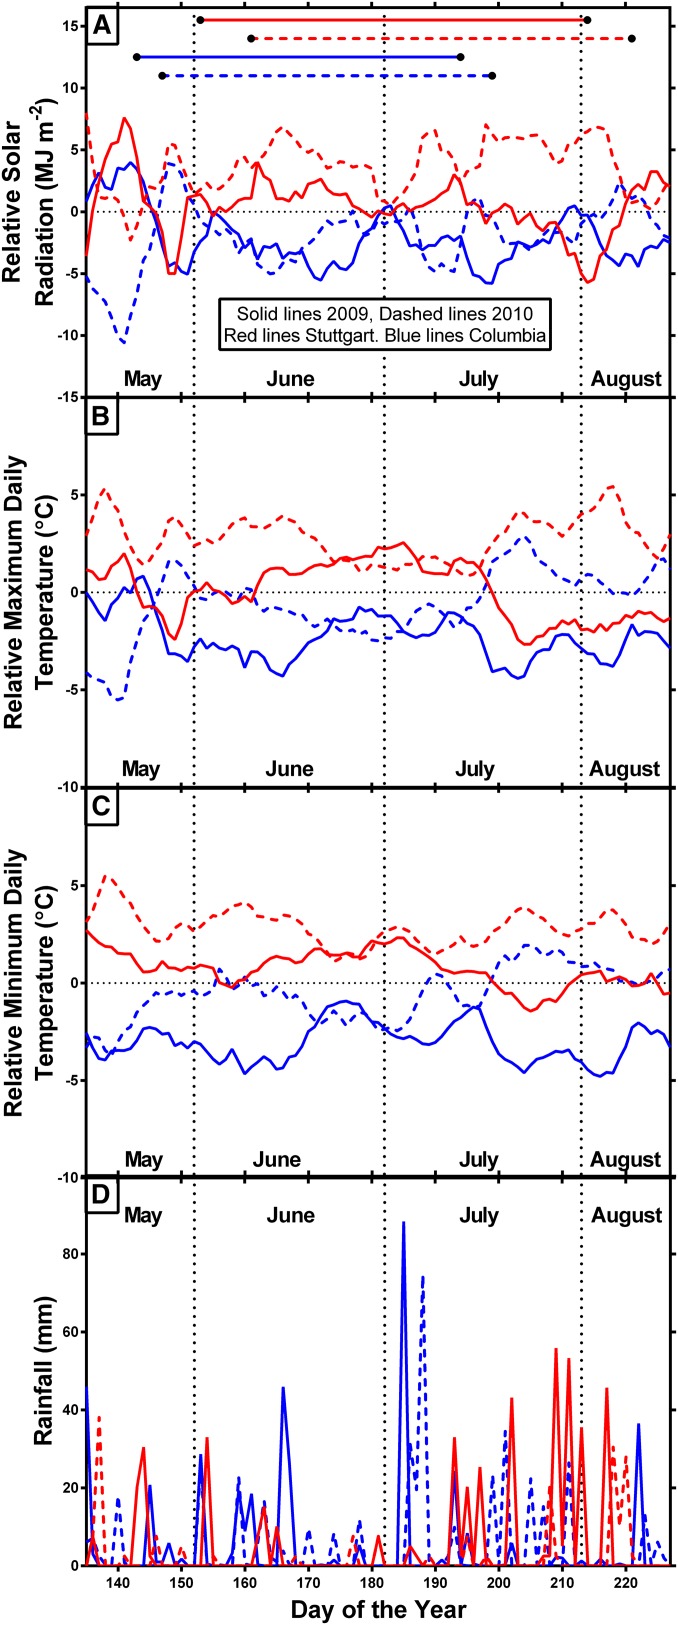
Figure 1.
The 7-d running average solar radiation (A), maximum temperature (B), and minimum temperature (C) relative to the average across all four environments (indicated by the zero line). Rainfall is shown as the unadjusted daily rainfall (D). Horizontal lines in (A) indicate the growing period between planting and sampling.

