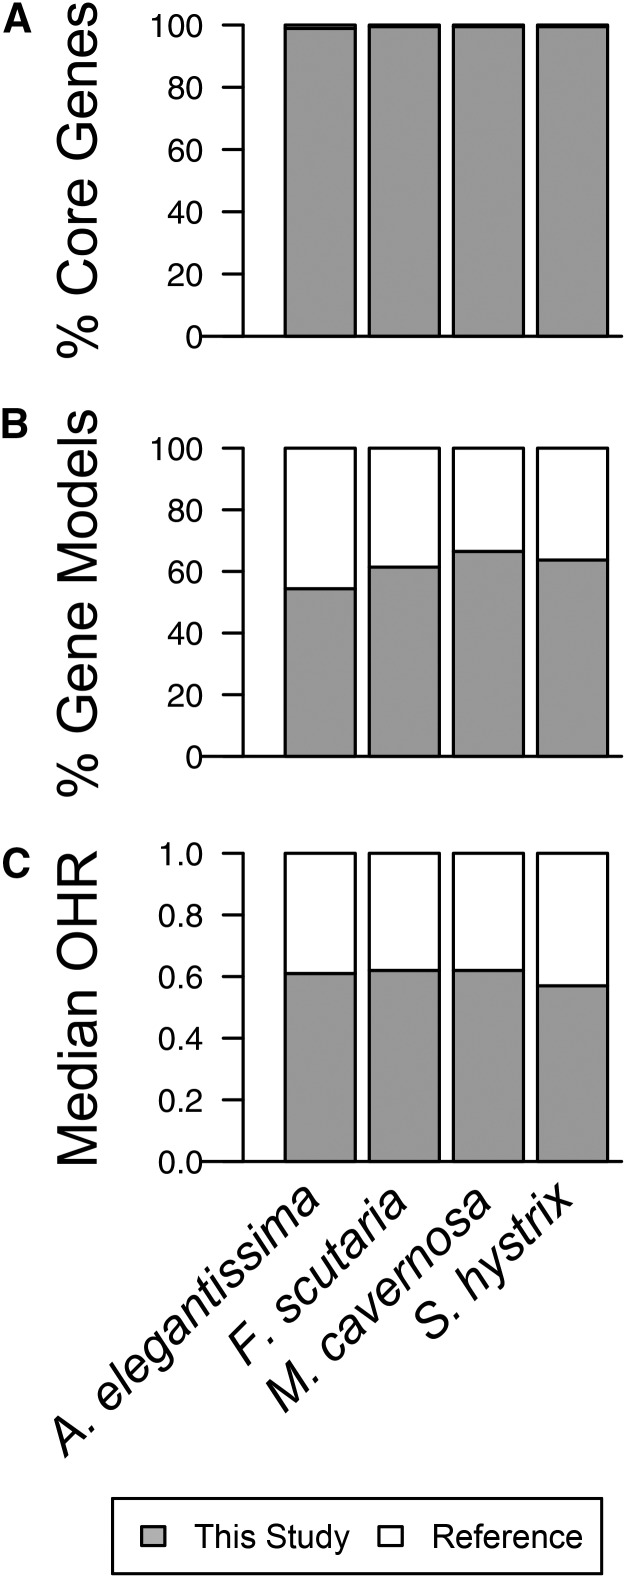
Figure 2.
Three metrics used to evaluate gene representation and assembly of complete transcripts in de novo transcriptome assemblies. (A) Percent of core eukaryotic genes (CEGMA) identified in each assembly. (B) Percent of A. digitifera gene models with significant matches in each assembly. (C) Median proportion of each N. vectensis protein aligned with transcripts in each assembly (OHRHITS). Gray = our transcriptome assembly compared to the respective reference for each analysis.

