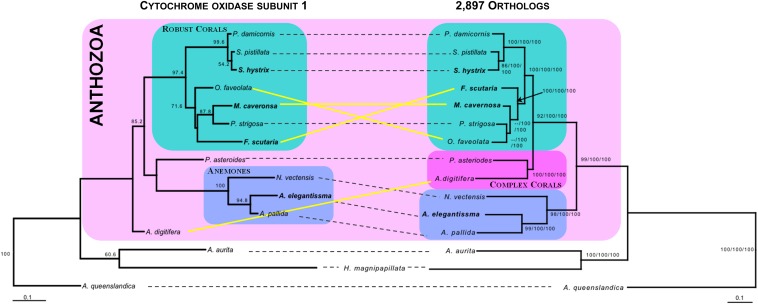
Figure 5.
Discordance in maximum likelihood phylogenetic reconstruction of COI compared to a combined phylogeny of concatenated ND (2, 4, and 5) genes and two phylogenomic trees. The COI phylogeny is presented on the left and the combined phylogeny is presented on the right. Topology for the ND mitochondrial set, relaxed and conservative phylogenomic trees were nearly identical. Therefore, nodal support is summarized on the relaxed tree (right). Bootstrap support at the nodes from left to right represents ND gene set/relaxed/conservative. If topologies differed in the summary tree, then the nodal support is presented - - as next to the node. Yellow solid lines connect taxon with different positions and/or relationships between the two trees, whereas black dashed lines connect those with the same position and/or relationship. Reconstructions of groups in the class Anthozoa based on Kitahara et al. (2010) are highlighted in boxes: teal= robust corals; dark pink = complex corals; and light blue = anemones. The names of species used in this study are emphasized by bold font. Scale bars indicate the amino acid replacements per site.

