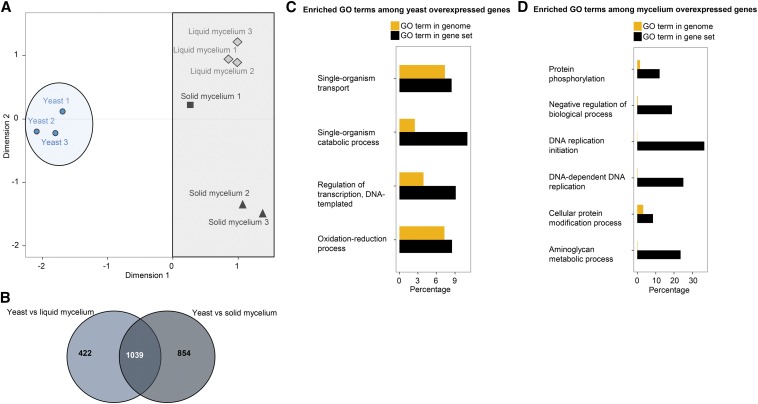
Figure 2.
Sample variability, differential gene expression, and Gene Ontology (GO) Enrichment analysis between yeast and mycelium samples of Ophiostoma novo-ulmi. (A) Multi-dimensional scaling plot of the nine RNA samples sequenced from yeast phase, mycelium grown in liquid medium (liquid mycelium), and mycelium grown on Petri plates (solid mycelium) inoculated with Ophiostoma novo-ulmi. Dot shapes indicate results of cluster analysis by k-means test; dot colors, growth conditions; blue circle, yeast phase; grey rectangle, all the mycelium samples. (B) Venn diagram of the number of differentially expressed genes (FDR ≤1%), depending on the comparison being made: yeast vs. mycelium grown in liquid medium (1460 differentially expressed genes in total, light blue); yeast vs. mycelium grown on Petri dishes (1852 differentially expressed genes in total, grey). Number of differentially expressed genes that are shared between the comparisons: 1039. Enriched GO terms (biological processes) in Ophiostoma novo-ulmi for (C) 397 annotated overexpressed genes in yeast; (D) 334 annotated overexpressed genes grown in the two mycelial conditions (liquid medium vs. Petri plates). Yellow bars indicate percentage of the whole genome related to a GO term. Black bars indicate percentage of total genes in a GO term that are present in the overexpressed set of genes. P ≤ 0.01 (Fisher’s exact test implemented in GOseq).

