Figure 2.
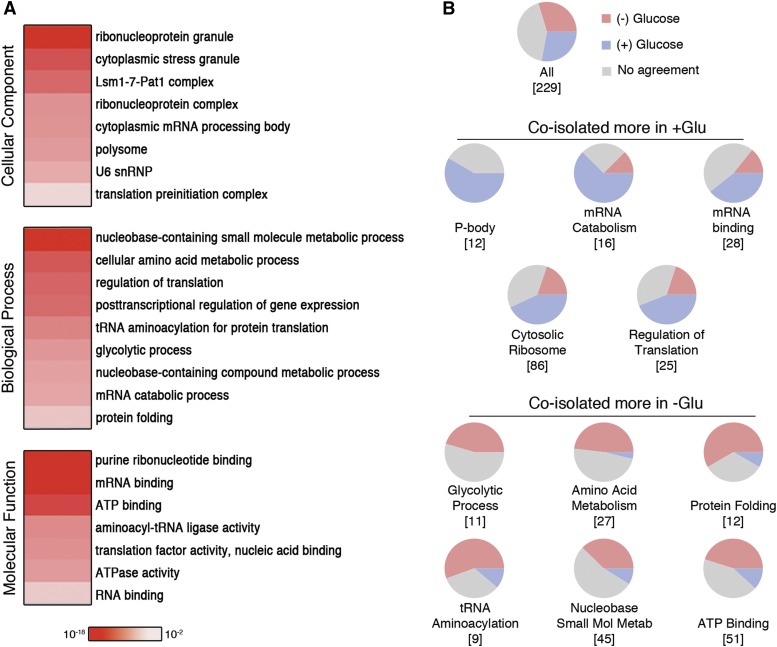
Protein constituents of Dhh1−GFP complexes. (A) Gene ontology (GO) enrichment represented as heatmap of 189 nonribosomal Dhh1−GFP-interacting proteins. Color intensity corresponds to the p-value from the hypergeometric test after correcting for multiple hypothesis testing. (B) Condition-specific coisolation of protein subsets with Dhh1−GFP. Pie charts show the proportion of proteins in each GO category that reproducibly change in abundance when coisolated with Dhh1−GFP from different growth conditions. Protein abundance was determined by the use of APEX-normalized spectral counts and further normalized to the level of Dhh1−GFP. Proteins that are reproducibly more abundant when coisolated with Dhh1−GFP from cells grown in +glucose are shown in blue, those reproducibly more abundant when coisolated from cells grown in −glucose are shown in red, or where there is no agreement between replicates in gray. The total number of proteins from each category measured in both spectral count experiments is indicated in square brackets.

