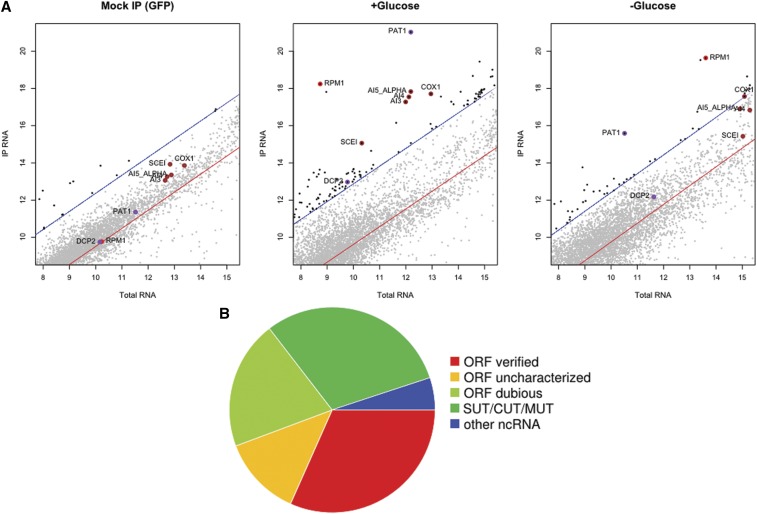
Figure 4.
Analysis of RNA isolated in Dhh1−GFP complexes. (A) Representative microarray data from a mock immunoprecipitation (IP; green fluorescent protein alone) as well as Dhh1−GFP immunoisolations from a +glucose and a −glucose condition. The x-axis in each plot is the log-transformed, normalized array intensity for input (total) RNA, and the y-axis is the log-transformed, normalized array intensity for IP RNA. In each plot, the red line is a linear regression between the signals from the IP and total RNA, and the blue lines correspond to the 95% confidence interval. Transcripts above 95% confidence interval are considered enriched (and shaded black). Specific transcripts that are enriched and discussed in the text are highlighted and labeled (red, RPM1; brown, mitochondrial introns; purple, PAT1 and DCP2). (B) The proportion of each RNA class within the total identified 79 transcripts. ORF, open reading frame; SUT, stable unannotated transcript; CUT, cryptic unannotated transcript; MUT, meiotic unannotated transcript.

