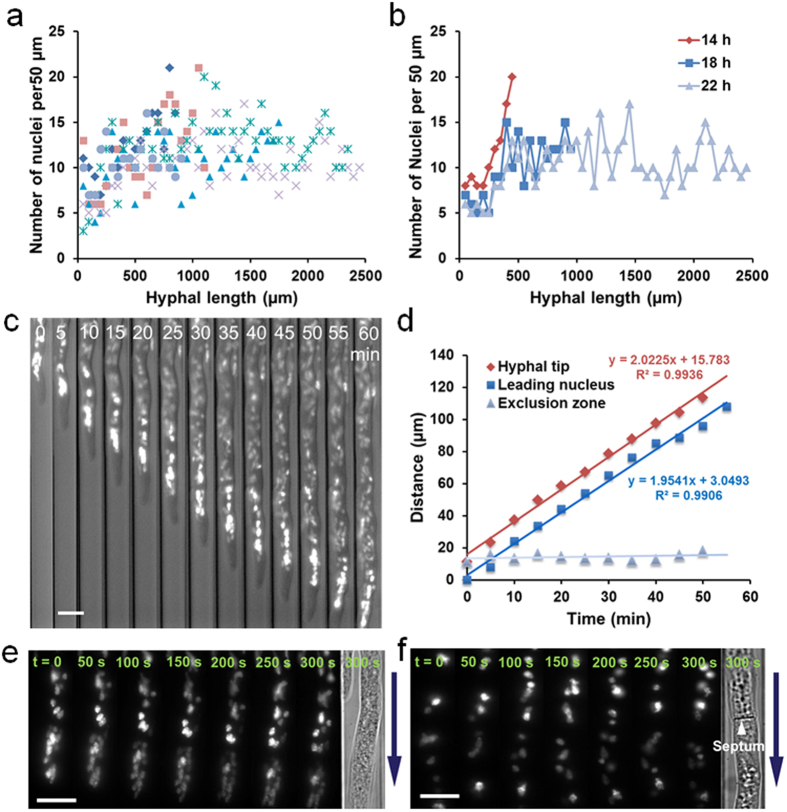
Figure 4. On-chip monitoring of nuclear organization and migration.
(a) The nuclear distribution of 6 hyphae growing for 22 h on one microchip. The number of nuclei per unit length (50 μm) in hyphae is plotted vs. the hyphal length from the conidia to the tips. (b) A representative nuclear distribution dynamics of a hypha at 14, 18 and 22 h. The distribution slightly changes over hyphal extension. (c) Time-lapse imaging of long-range nuclear migration with combined bright-field and fluorescence microscopy over 60 min at intervals of 5 min. Scale bar, 10 μm. (d) Quantification of the extension of hyphal tip, the migration of leading nucleus, and the distance of nuclear exclusion zone in (c). (e) Nuclear dynamics in an apical compartment. The images are from Supplementary Video 2. Scale bar, 10 μm. (f) Nuclear dynamics in parts of two adjacent subapical compartments. The images are from Supplementary Video 3. Scale bar, 10 μm. The arrows in (e,f) indicate the direction of hyphal extension. In the experiments, N. Crassa strain NMF617 expressing histone H1-RFP is grown in 2.5 mm × 10 μm × 10 μm channels under the constant flow of 10% glucose in 1× Vogels’ salts solution at 0.3 μL/min.

