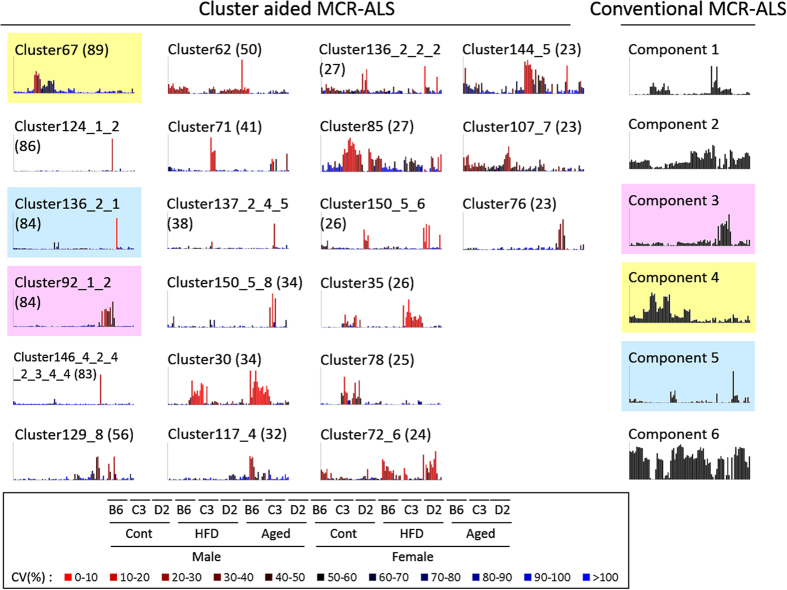
Figure 2. Results of cluster-aided multivariate curve resolution-alternating least squares (MCR-ALS) and conventional MCR-ALS.
Concentration profiles of the results of urinary data analysis. In the bar graph, the order of the samples is indicated at the bottom of the figure. B6, C57BL/6J; C3, C3H/HeJ; D2, DBA/2J; Cont, control group; HFD, high-fat-diet-fed group; Aged, aged group. Typical concentration profiles in 21 identified reliable clusters analyzed by cluster-aided MCR-ALS are shown on the left side of the figure. Six components analyzed by conventional MCR-ALS are shown on the right side. The number in parentheses indicates the cluster size. Colored clusters/components indicate that the component belongs to the same color cluster. Scales of bar graphs are in arbitrary units. The colors of the bars correspond to coefficients of variation.

