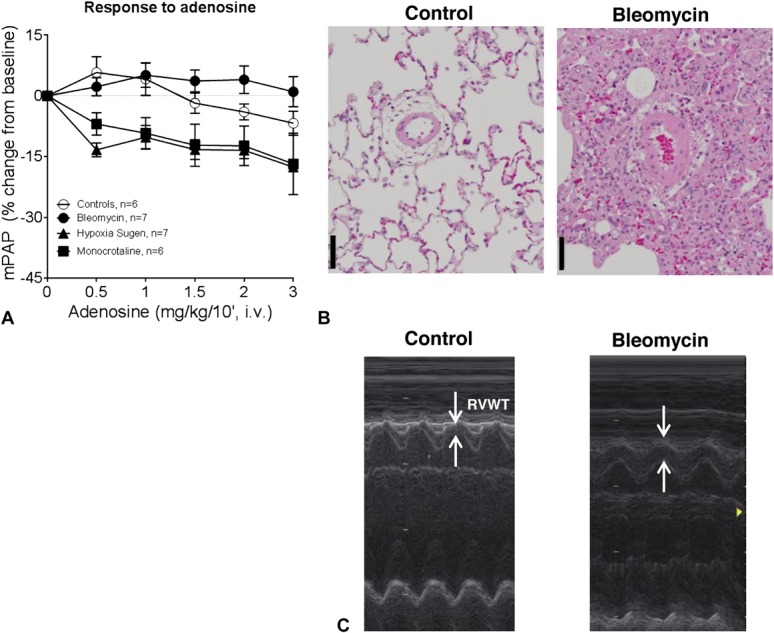
FIGURE 1.

Characterization of the non-vasoreactive bleomycin-induced PH model. A, Dose–response curve for adenosine (intravenous) on mPAP in anesthetized rats without (controls) or with PH; n = 6–7 per group. B, Representative pictures of pulmonary arterial remodeling in control (left) and bleomycin-instilled rats (right). Hypertrophied pulmonary arterioles of bleomycin rats are surrounded by stromal changes, such as fibrotic foci and edema. Staining: hematoxylin and eosin (scale bar represents 50 μm). C, Representative M-mode measurements of RV free wall thickness (RVWT) as observed in the parasternal short axis view.
