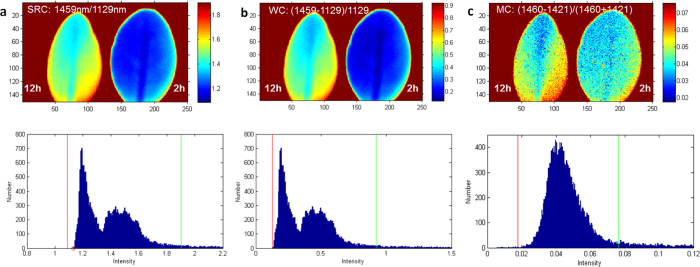
Figure 6.

Images of leaves using band ratios from SRC, WC and MC (a) using the highest values from SRC, (b) using the highest values from WB, (c) using the highest values from MC. The images are shown within given boundaries on the corresponding histograms. Blue pixels correspond to the histogram with lower intensity, red to higher intensity.
