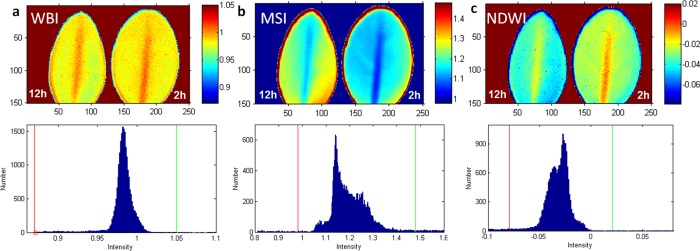
Figure 9. Images and histograms obtained using traditional indices.

(a) WBI index 900 nm/970 nm. The common range of values for green vegetation is 0.8 to 1.2. (b) Moisture Stress Index (MSI) = 1599 nm/819 nm. The common range for green vegetation is 0.4 to 2. (c) Normalized Difference Water Index (NDWI) = (857 nm–1241 nm)/(857 nm + 1241 nm). The common range for green vegetation is −0.1 to 0.4. Left leaf −12 h post detachment, right leaf −2 h post detachment. The images correspond to the histogram within specified red and green boundaries and correspond to the scale of intensities.
