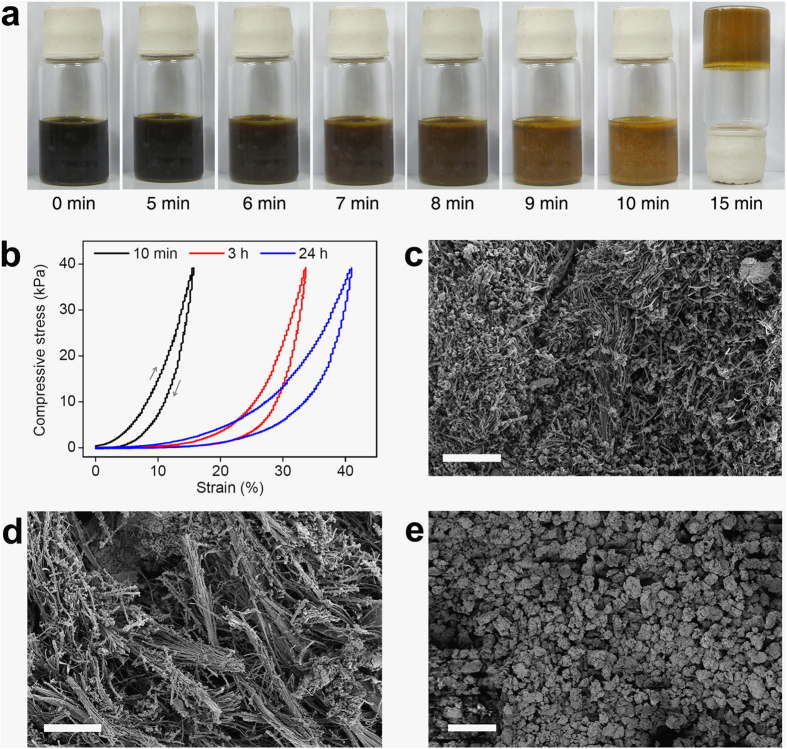
Figure 4. Effect of the reaction time on MP-0.8.
(a) Time-dependent images of a reaction mixture of PBT-Br and TEB (molar ratio = 0.8:1) in toluene/DMF (1:1, v/v) on a hotplate. (b) Strain–stress curves of the samples obtained after different reaction times. SEM images of the samples obtained after a reaction time of (c) 10 min and (d) 3 h (scale bars = 40 μm). (e) SEM image of MP-lin (scale bar = 40 μm).

