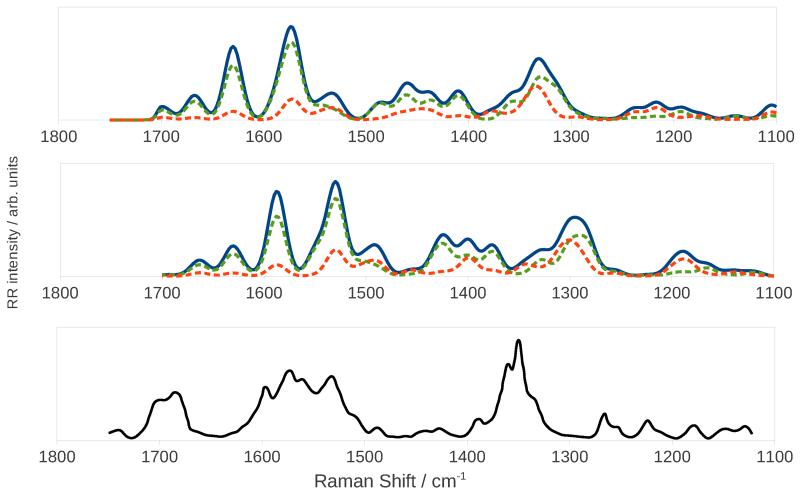
Figure 12.
Harmonic (top panel) and anharmonic (middle panel) RR spectra of ChlA1 in methanol. The continuous blue line is the total spectrum, the dashed orange and green lines the spectra for the S3 and S4 states respectively. The bottom panel shows the experimental RR spectrum of PChlide.121

