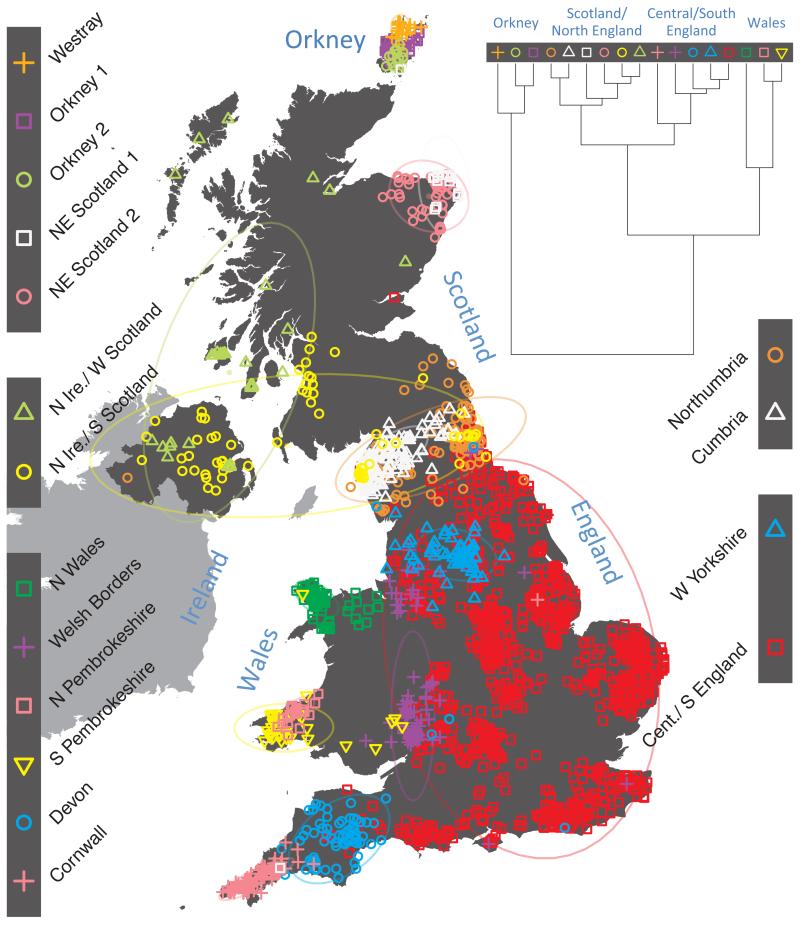
Figure 1. Clustering of the 2,039 UK individuals into 17 clusters based only on genetic data.
For each individual, the coloured symbol representing the genetic cluster to which the individual is assigned is plotted at the centroid of their grandparents’ birthplace. Cluster names are in side-bars and ellipses give an informal sense of the range of each cluster (see Methods). No relationship between clusters is implied by the colours/symbols. The tree (top right) depicts the order of the hierarchical merging of clusters (see Methods for the interpretation of branch lengths).

