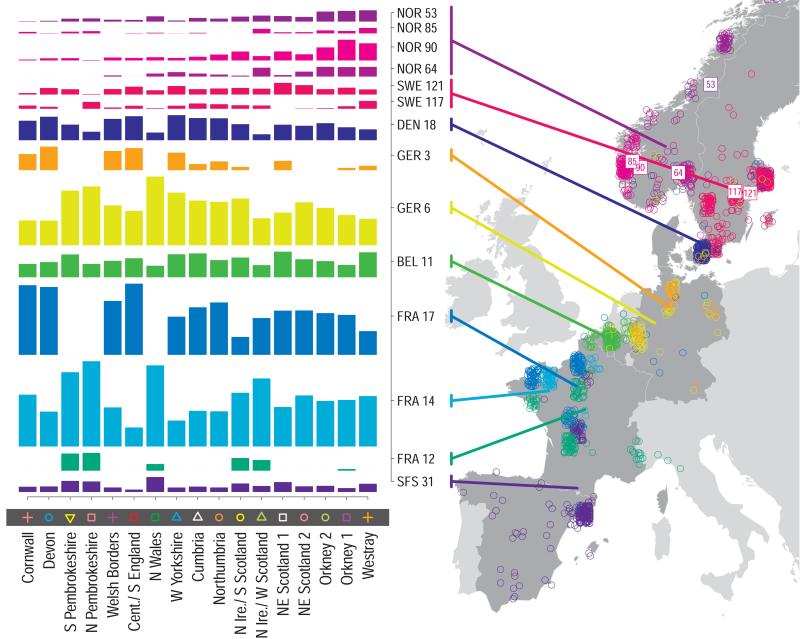
Figure 2. European ancestry profiles for the 17 UK clusters.
Each row represents a European group (labels at right). Each column represents a UK cluster. Coloured bars have heights representing the proportion of the UK cluster’s ancestry best represented by that of the European group labelled with that colour. The map shows the location (when known at regional level) of the samples assigned to each European group (some sample locations are jittered and/or moved for clarity, see Methods). Lines join group labels to the centroid of the group, or collection of groups (Norway, Sweden, with individual group centroids marked by group number).

