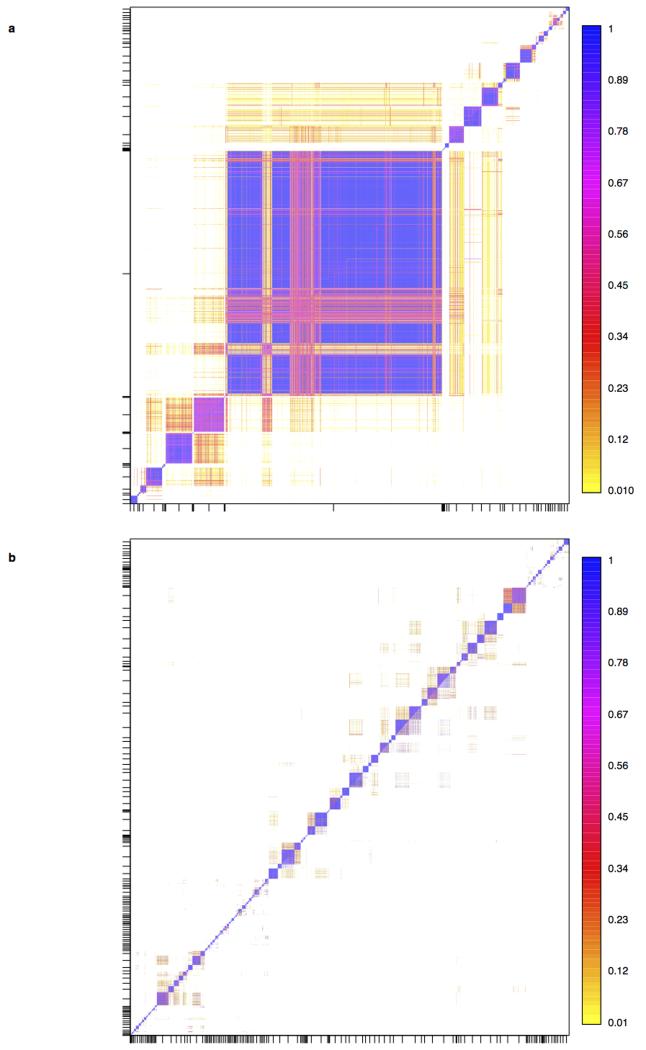
Extended Data Figure 2. Convergence of the algorithm implemented in fineSTRUCTURE.
The fineSTRUCTURE clustering algorithm was run twice on the UK samples (a) and twice on the European samples (b) to assess convergence. The displayed heatmap depicts the proportion of sampled MCMC iterations for which each pair of UK individuals is assigned to the same cluster. The values above and below the diagonal represent two different runs of fineSTRUCTURE. Individuals are ordered along each axis according to the inferred tree from the fineSTRUCTURE run above the diagonal, with tick-marks on the axes at the middle of each cluster. Comparison between runs is made by comparing the plot above the diagonal (run two) with that below the diagonal (run one). The high degree of symmetry in the plot confirms the similarity between the runs and hence that each MCMC run has converged to very similar clusters.

