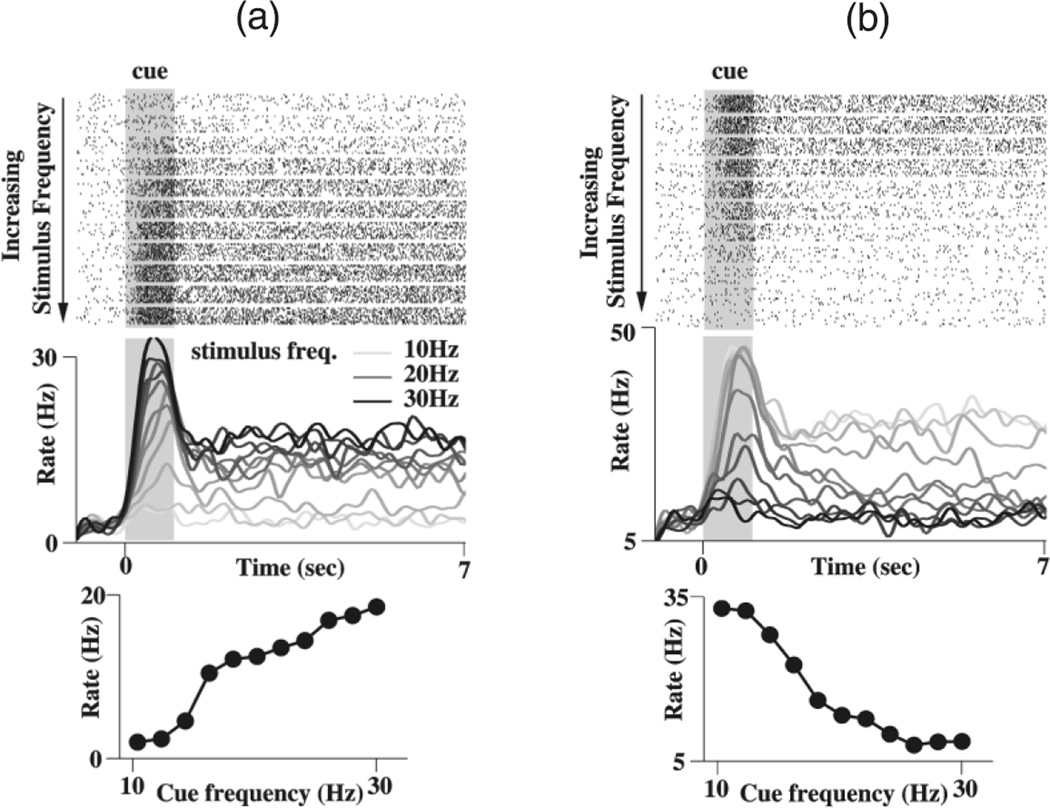
Figure 2.
Persistent neural activity of the parametric working memory model. (a) A positively monotonic, excitatory cell. Top panel: rastergrams, showing spikes in blocks of 10 trials, each block corresponding to a fixed stimulus frequency. The cell initially fires spikes at a few Hertz spontaneously. A transient stimulus (shaded) produces a large response, followed by persistent activity after the stimulus offset. The firing rate of both the transient response and persistent activity increases with the stimulus frequency. Middle panel: trial-averaged neural firing rate, where darker shades of gray represent increasing stimulus frequency. Bottom panel: the tuning curve shows the average rate in the last 5s of the delay period following each stimulus. (b) A negatively monotonic inhibitory interneuron, same plots as (a).

