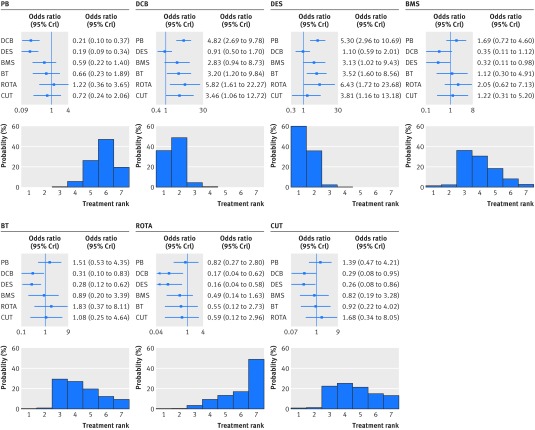
Fig 3 Effect of interventional treatments on risk of target lesion revascularisation. Forest plots show relative effect of each treatment on target lesion revascularisation as compared with a common reference treatment. Histograms are shown for each treatment reflecting corresponding probabilities for each position in the ranking of the seven strategies (rankograms). I2 value=43.5%. PB=plain balloon; DCB=drug coated balloon; DES=drug eluting stent; BMS=bare metal stent; BT=brachytherapy; ROTA=rotational atherectomy; CUT=cutting balloon; OR=odds ratio; CrI=credible interval

An official website of the United States government
Here's how you know
Official websites use .gov
A
.gov website belongs to an official
government organization in the United States.
Secure .gov websites use HTTPS
A lock (
) or https:// means you've safely
connected to the .gov website. Share sensitive
information only on official, secure websites.
