Fig. 5.

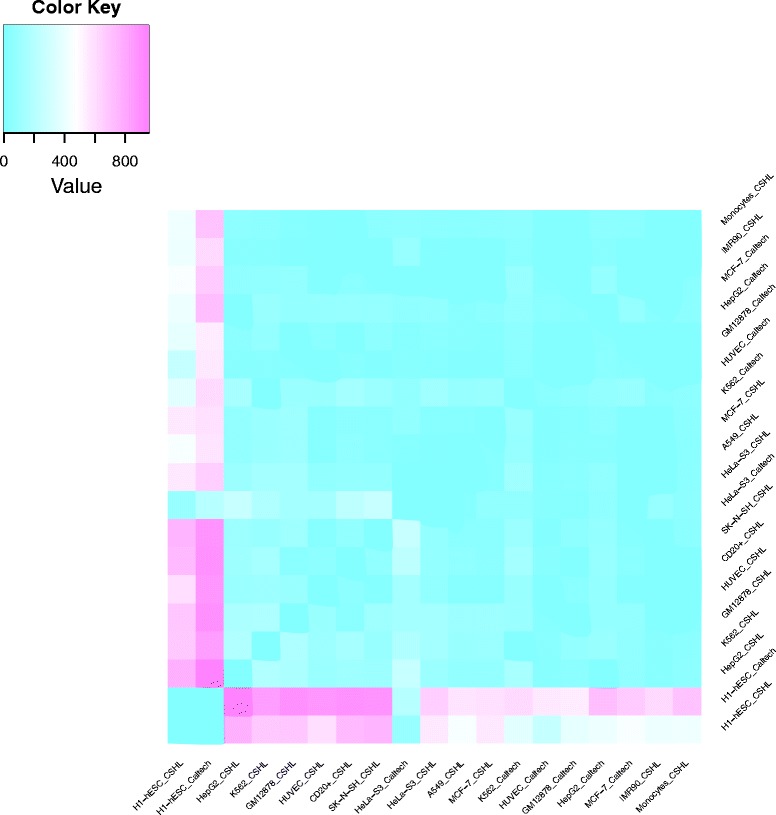
Heatmap of significantly differentially expressed HERV loci. Number of significantly (|log2 fold change| at least one, adjusted p-value < 0.001) differentially expressed HERV loci in pairwise comparisons. Ice blue fields show comparisons yielding none or very few differentially expressed loci, hot pink represents large numbers (up to 956)
