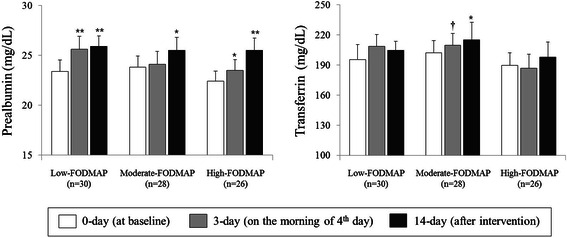
Fig. 3.

Short-term nutritional status in response to EN treatment. Values presented as means ± S.E.; statistical significance of within group differences was assessed by paired t-test. There were no significant differences in baseline values among the three groups. †P < 0.1, *P < 0.05, **P < 0.01 compared with baseline values
