Figure 3.

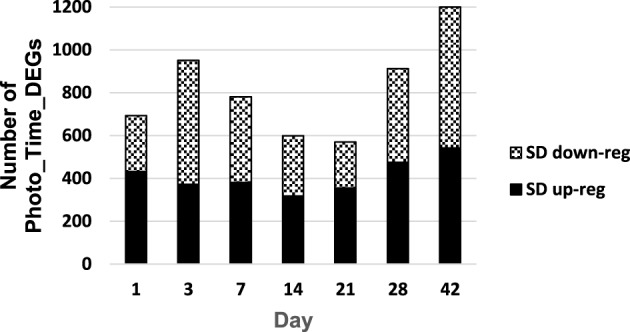
Number of photoperiod x time differentially expressed genes (Photo_Time_DEGs) that (1) had a significant photoperiod x time interaction effect and (2) were differentially expressed between photoperiod treatments on a particular day.

Number of photoperiod x time differentially expressed genes (Photo_Time_DEGs) that (1) had a significant photoperiod x time interaction effect and (2) were differentially expressed between photoperiod treatments on a particular day.