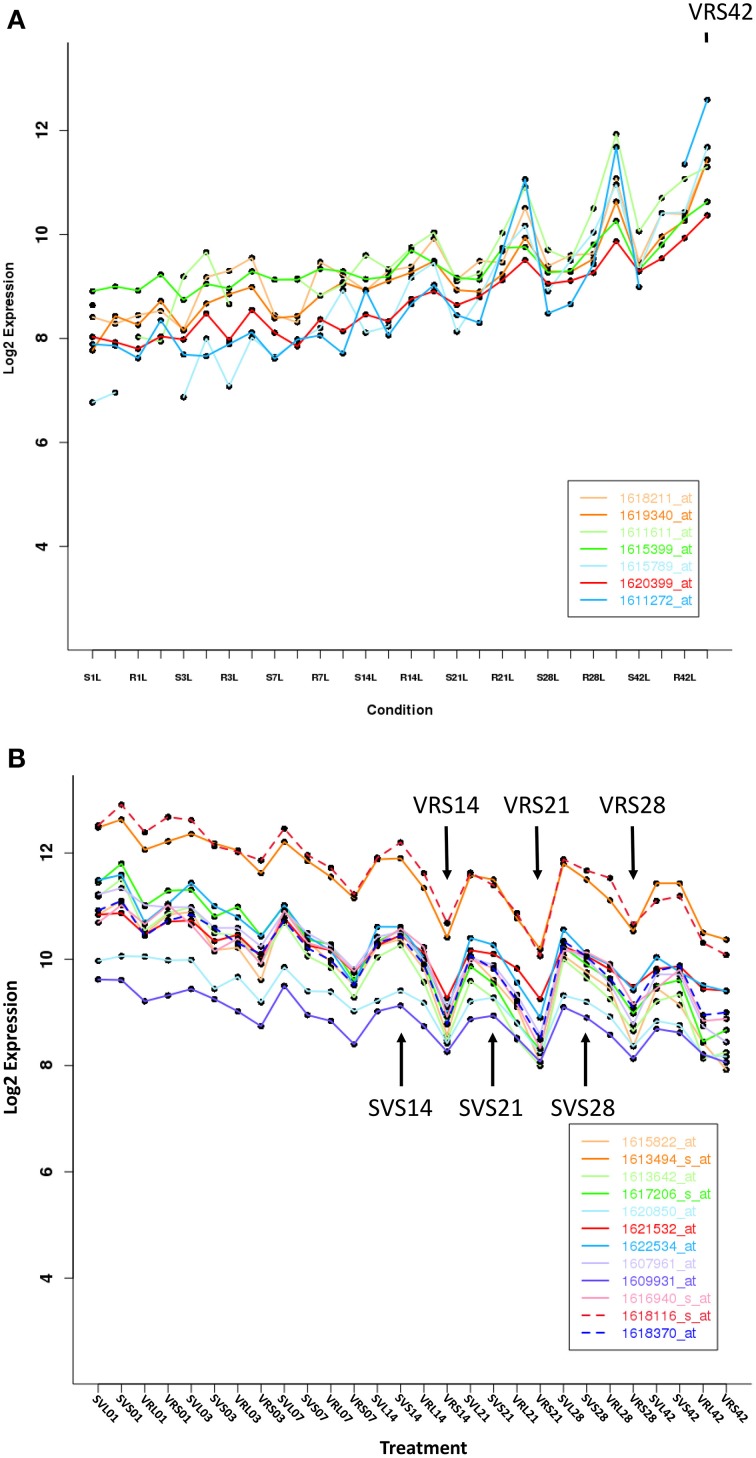
Figure 4.
Expression patterns for representative genes that are significantly up- or down-regulated at one or more time point in V. riparia (VR) or Seyval (SV). (A) Up-regulation gene expression pattern in response to short day treatment (VRS, SVS). (B) Down-regulation expression pattern in response to short day treatment. Expression values are log2-transformed means across replicates after normalization (n = 6). Arrows indicate VRS and SVS expression responses that were not similar during dormancy induction.

