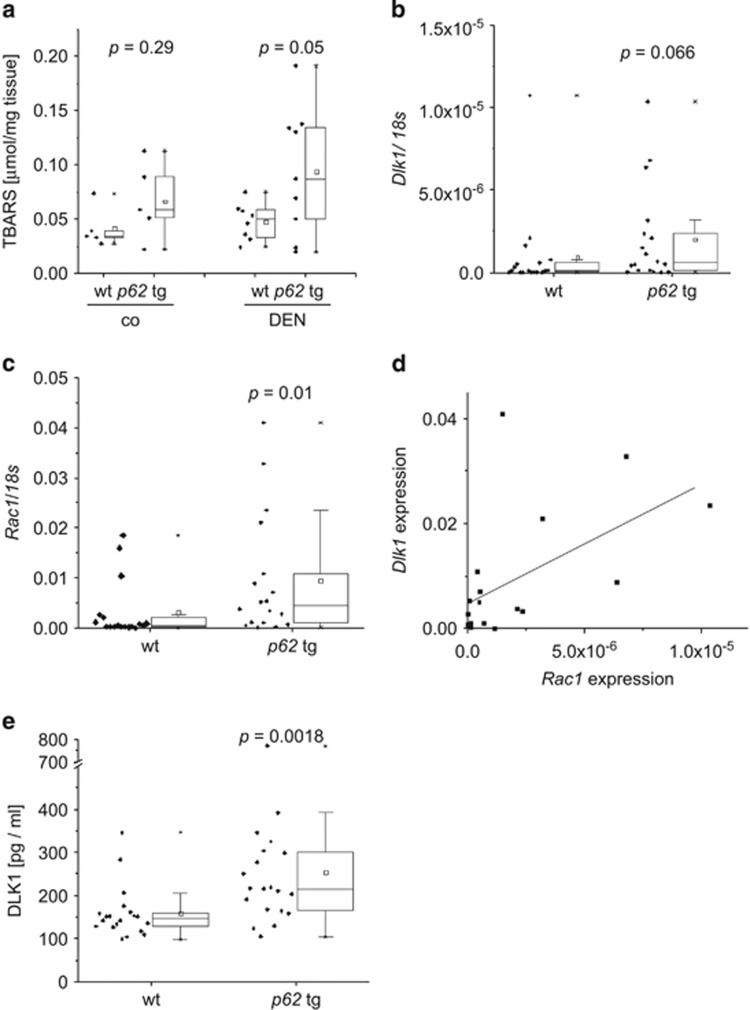
Figure 6.
Increased levels of ROS and ROS-inducer RAC1 in p62 transgenic mice. (a) Hepatic TBARS levels in wt (n=5) and p62 tg (n=5) livers of untreated (co) and 48-h DEN-treated (DEN) animals (wt: n=8; tg: n=9). Error bars show the interquartile range. (b–d) Dlk1 (b) and Rac1 (c) mRNA expression as well as correlation of both d was investigated after 8 months (wt: n=18; tg:n=18). Error bars show the interquartile range. (e) Secreted DLK1 protein serum levels were measured by ELISA. Error bars show the interquartile range

