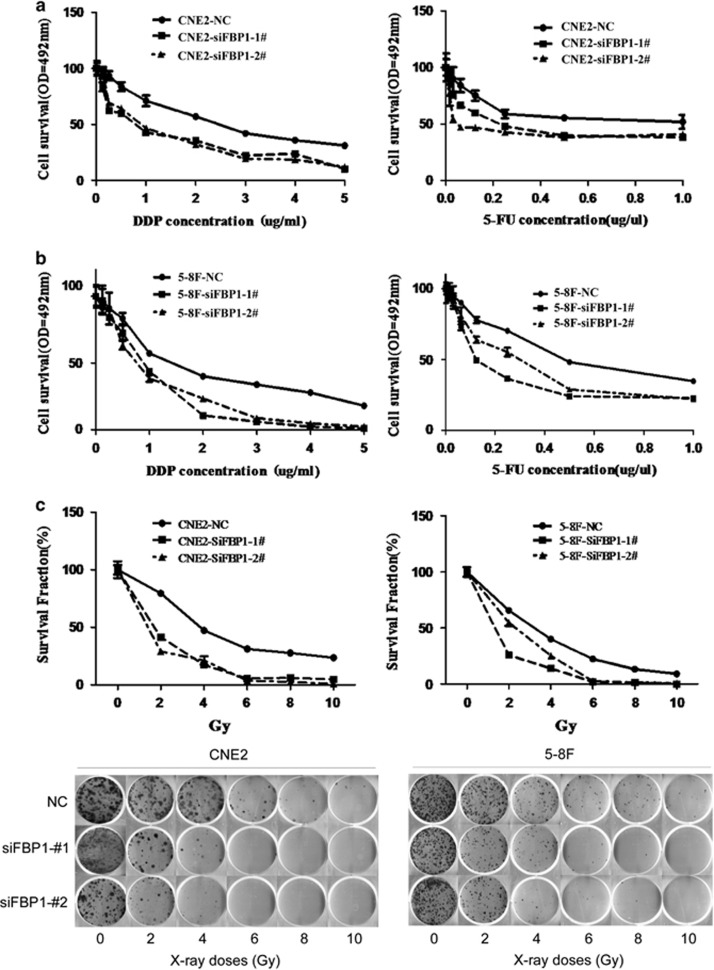
Figure 4.
Results of radiation and chemotherapy sensitivity. (a) The growth curves of CNE2 cells transfected with NC- or FBP1-targeting (KD) siRNAs at 48 h post treatment with the indicated doses of DDP (left panel) and 5-FU (right panel). (CNE2-NC versus CNE2-siFBP1-1#1 and siFBP1-2#, P<0.001 by the paired t-test). (b) The growth curves of 5-8F cells transfected with NC- or FBP1-targeting (KD) siRNAs at 48 h post treatment with the indicated doses of DDP (left panel) and 5-FU (right panel). (5-8F-NC versus 5-8F-siFBP1-1# and 5-8F-siFBP1-2#, P<0.05, by the paired t-test). (c) The survival fraction (SF) curves (upper panel) and the representative pictures of CNE2 and 5-8F cells transfected with NC- or FBP1-targeting (KD) siRNAs at 10 days after X-ray irradiation with the indicated Gy doses (lower panel). (NC versus siFBP1-1#1 in CNE2 and 5-8F, P<0.05; NC versus siFBP1-2# in CNE2 and 5-8F, P<0.01 by the paired t-test)

