Figure 6.
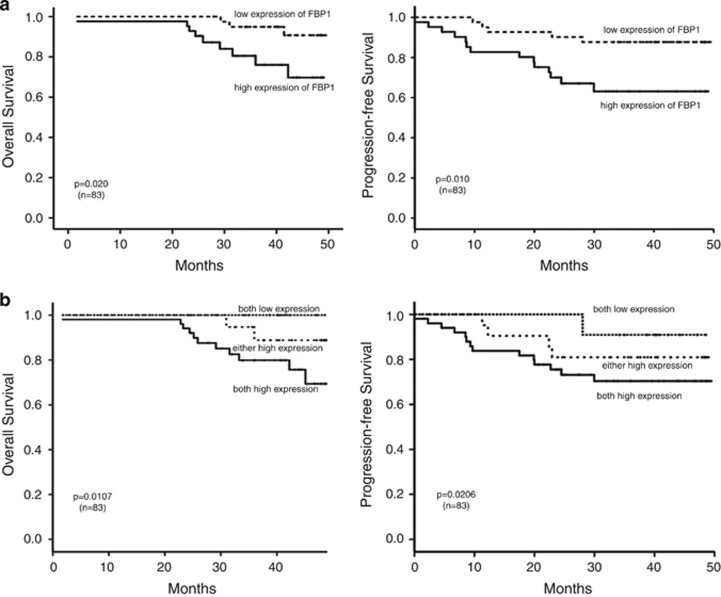
Relationship between FBP1 and patient survival. (a) Overall survival curves and progression-free survival curves of patients with low and high FBP1 expression. (b) Overall survival curves and progression-free survival curves of patients with high expression of both FBP1/c-Myc, low expression of both FBP1/c-Myc and high expression of either FBP1 or c-Myc

