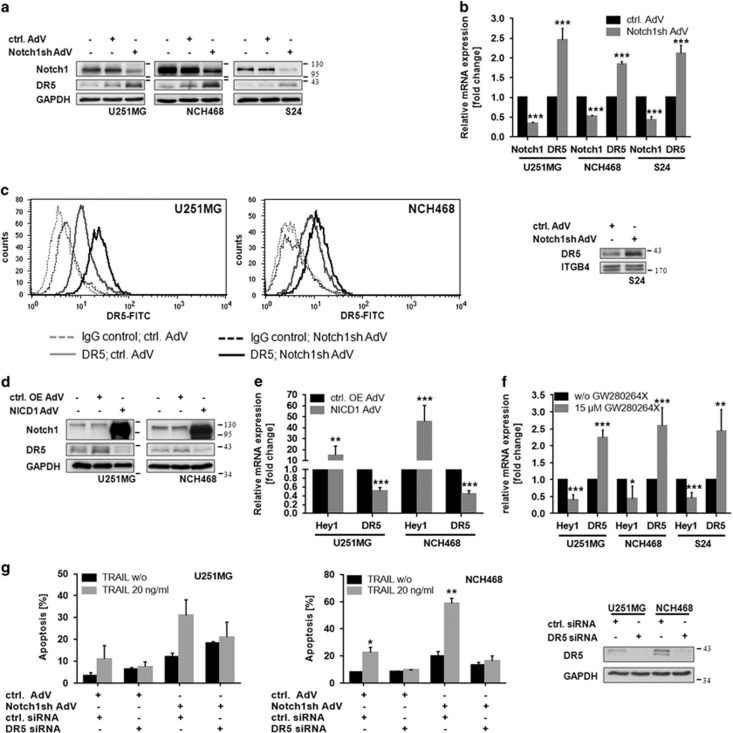
Figure 2.
Notch1 signaling regulates the DR5 protein. (a) Immunoblot analysis of Notch1 and DR5 in wild type, control-AdV and Notch1sh-AdV transduced U251MG, NCH468 and S24 cells 72 h post transduction. (b) Quantitative real-time PCR analysis of Notch1 and DR5 mRNA expression in control-AdV and Notch1sh-AdV transduced glioblastoma cells 72 h post transduction. Expression data were normalized to internal 18 S rRNA expression (n=3, mean±S.D.). P-values were determined by t-test. (c) Inhibition of Notch1 signaling increases the amount of DR5 at the cell surface. Amount of DR5 located at the membrane was determined by flow cytometry using a FITC-labeled anti-DR5 antibody and a FITC-labeled IgG as a control (left and middle panel) or by performing membrane fractionation (right panel). For the latter ITGB4 served as a loading control. (d) Immunoblot analysis of Notch1 and DR5 in wild type, control OE-AdV (empty), and NICD1-AdV transduced glioblastoma cells 72 h post transduction. (e) Quantitative real-time PCR analysis of the Notch1 target gene Hey1 and DR5 mRNA expression in control OE-AdV (empty) and NICD1-AdV transduced glioblastoma cells 72 h post transduction. Expression data were normalized to internal 18 S rRNA expression (n=3, mean±S.D.). P-values were determined by t-test. (f) Quantitative real-time PCR analysis of the Notch1 target gene Hey1 and DR5 mRNA expression in U251MG, NCH468 and S24 cells following treatment with the ADAM inhibitor GW280264X (15 μM) for 48 h. Expression data were normalized to internal 18 S rRNA expression (n=3, mean±S.D.). P-values were determined by t-test. (g) Control-AdV and Notch1sh-AdV transduced U251MG and NCH468 cells (24 h) were transfected with control siRNA and DR5 siRNA, respectively. Cells were treated with TRAIL 48 h post transfection for 24 h. Apoptotic cell death was measured by flow cytometry (n=2; mean ±S.D.). P-values were determined by t-test (left and middle panel). Immunoblot analysis for DR5 48 h post transfection (right panel)

