Figure 4.
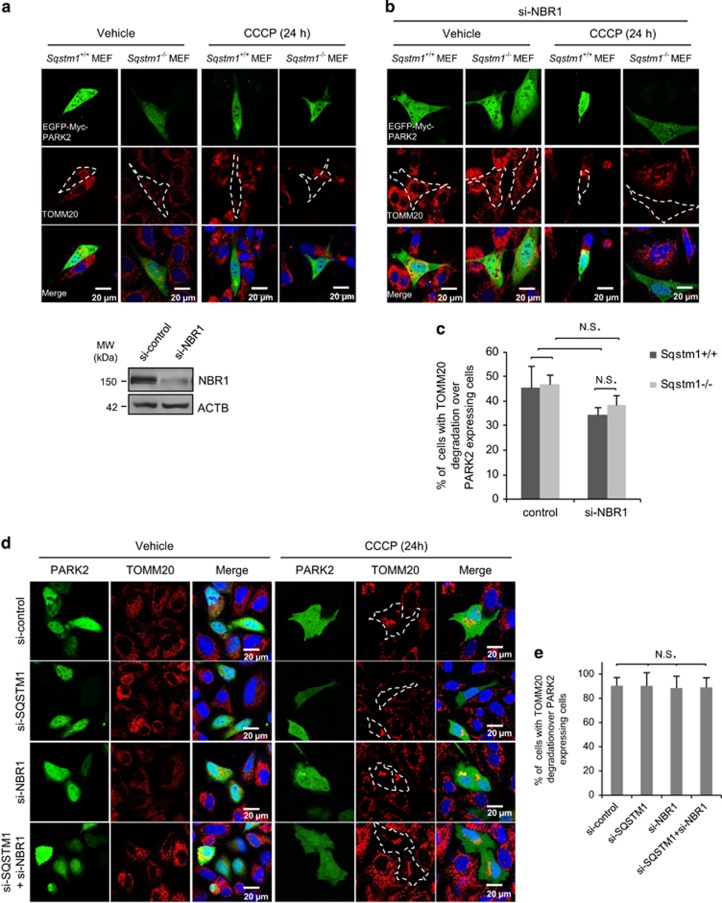
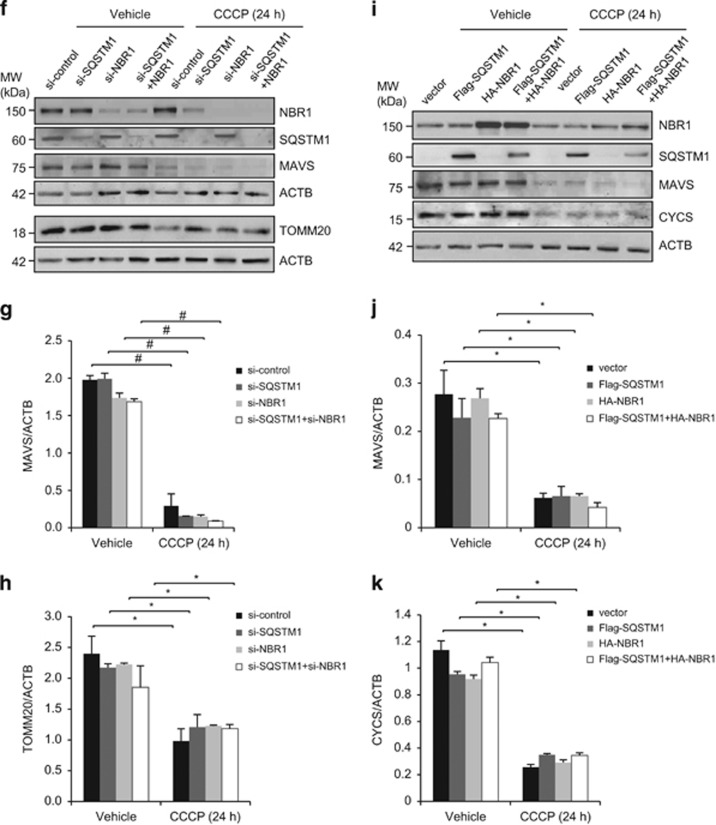
NBR1 is dispensable for CCCP-induced mitophagy regardless of the presence or absence of SQSTM1. (a) Sqstm1 wide-type (Sqstm1+/+) or deficient (Sqstm1−/−) MEFs were transiently transfected with a plasmid expressing EGFP-Myc-PARK2 for 24 h. Cells were then treated with vehicle or CCCP (10 μM) for 24 h. PARK2 was displayed in green and TOMM20 was stained in red. The percentage of cells with TOMM20 degradation relative to total counted cells expressing PARK2 (n) was presented. (b and d) Sqstm1 wide-type or deficient MEFs (b) and regular HeLa cells (d) were transiently transfected with si-NBR1 for 24 h, followed by second transfection with EGFP-Myc-PARK2 plasmid for additional 24 h. Cells were then treated with vehicle or CCCP for 24 h. PARK2 signal was shown in green and TOMM20 was stained in red. Quantification was performed as described above. The si-NBR1 knockdown efficiency in MEFs was evaluated by western blotting. (c and e) Immunostaining results in (a, b, and d) were quantified as percentages of cells with TOMM20 degradation relative to total number of PARK2-expressing cells (at least 10 cells were counted for each image in a and b and 30 or more cells were counted for each image in d, mean±S.D., n=3 images). NS, not significant. (f) PARK2 stably expressing HeLa cells were transiently transfected with si-NBR1 and si-SQSTM1 alone or in combination as indicated for 48 h, followed by vehicle or CCCP (10 μM) treatment for 24 h. The knockdown efficiency of si-NBR1 and si-SQSTM1 and protein levels of mitochondrial proteins were examined by western blotting. (g and h) Densitometric analysis of protein levels of MAVS and TOMM20 after normalized to ACTB (mean±S.D., n=3). #P<0.01; *P<0.05. (i) HeLa cells stably expressing PARK2 were transiently transfected with HA-NBR1 and Flag-SQSTM1 alone or in combination as indicated for 24 h, followed by vehicle or CCCP (10 μM) treatment for 24 h. The cDNA transfection efficiency and protein levels of mitochondrial proteins were examined by western blotting. (j and k) Densitometric analysis of protein levels of MAVS and CYCS after normalized to ACTB (mean±S.D., n=3). *P<0.05


