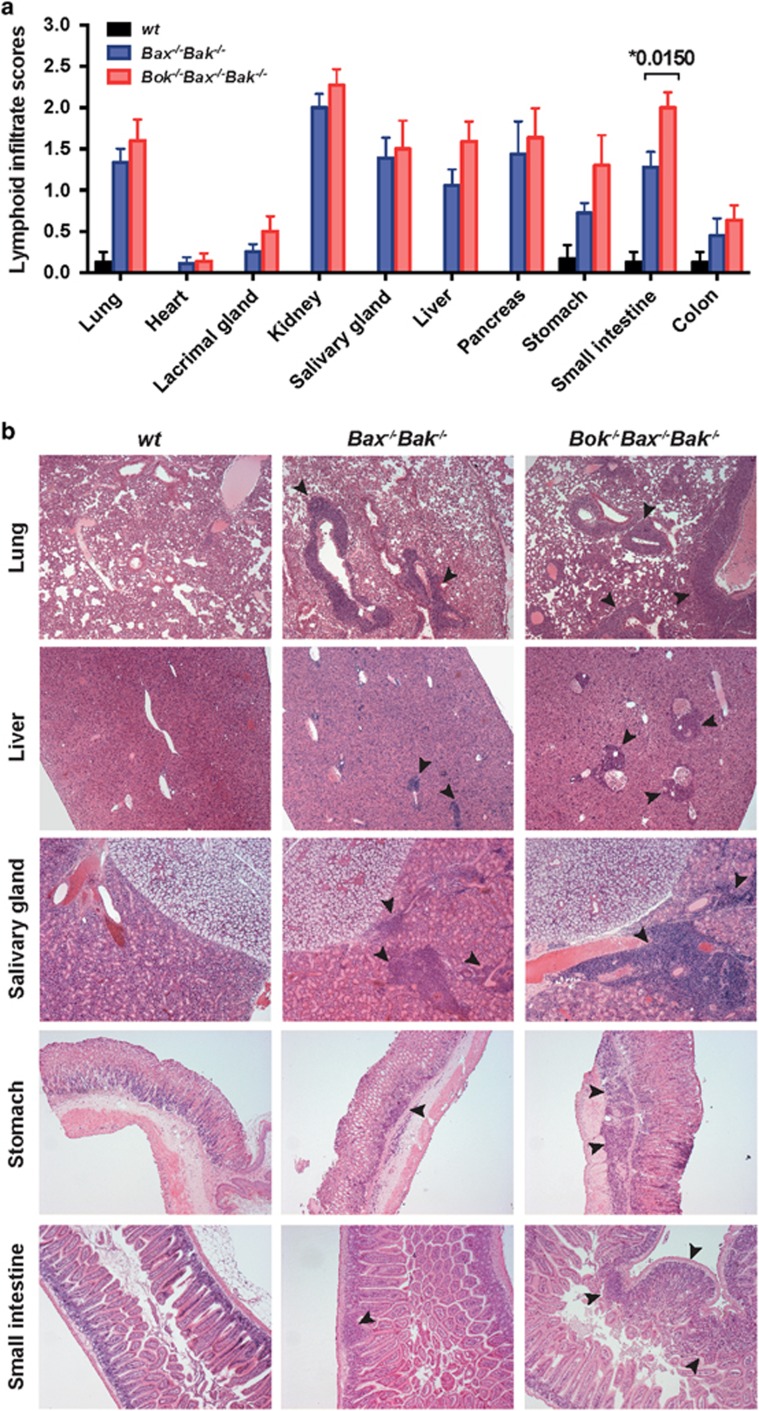
Figure 4.
TKO hematopoietic chimeras display substantial lymphocytic infiltration in several organs. (a) Summary of the incidence of lymphocytic infiltration (scored on a scale of 0–3) into the indicated organs. Bar graphs represent mean±S.E.M of score for each tissue from mice reconstituted with wt (n=4), Bax−/−Bak−/−DKO (n=9) or Bok−/−Bax−/−Bak−/−TKO (n=11) FLCs, P<0.05. Tissues were harvested at the time when mice were sick (for DKO and TKO chimeras) or at termination of the experiment (for wt controls). (b) Representative H&E stained sections depicting leukocyte infiltration in the lung, liver, salivary glands, stomach and small intestine of mice reconstituted with FLCs of the indicated genotype. Arrows indicate areas of infiltration (Magnification: × 5)

