Fig. 4.

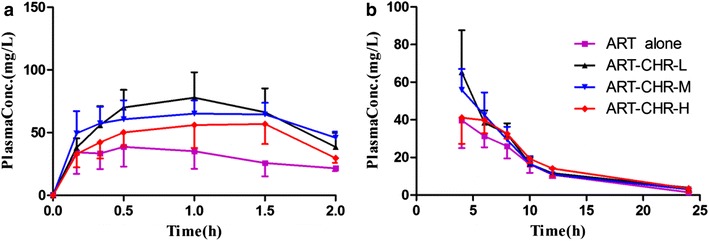
Mean (±SD) plasma concentration–time profiles of ART (n = 5) in ART alone (square points), ART-CHR-L (triangular points), ART-CHR-M (inverted triangular points), and ART-CHR-H (diamond points). a before 2 h, b after 2 h

Mean (±SD) plasma concentration–time profiles of ART (n = 5) in ART alone (square points), ART-CHR-L (triangular points), ART-CHR-M (inverted triangular points), and ART-CHR-H (diamond points). a before 2 h, b after 2 h