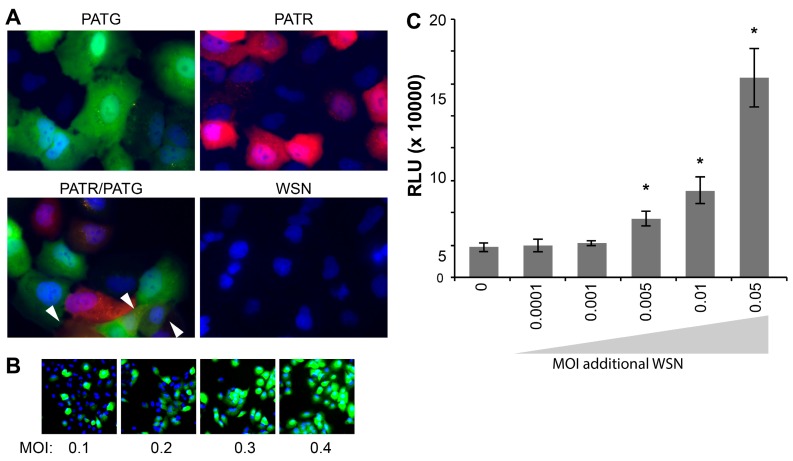
Figure 3.
Influenza reporter viruses detect infection, co-infection, “semi-infection” and multiplicity reactivation. Live cell imaging of viral gene expression in infected cells. (A) A549 cells were infected with PATG, PATR, WSN or co-infected with PATG and PATR. Infected cells were detected by fluorescence microscopy 18–19 hours post-infection (hpi) and cells were counter-stained with Hoechst 33342 to detect nuclei. Co-infection is indicated by the arrowheads; (B) A549 cells were infected with an increasing MOI of PATG. Cells were imaged to detect total cells (Hoechst 33342) and those expressing a virally encoded gene (GFP). All of the cells are GFP-positive when only an MOI = 0.4 is used; (C) Multiplicity reactivation rescues viral gene expression. A total of 25,000 MDCK cells were infected in a 96-well format with PASTN at an MOI = 0.005. Where indicated, cells were also simultaneously infected with increasing amounts of WSN. A luciferase activity assay was performed 10 hpi to determine PASTN gene expression for each condition (average relative light units (RLU), Data are mean of n = 4 ± sd). Conditions with a statistically significant increase in gene expression compared to PASTN alone are marked (* p < 0.05, Student’s t-test).

