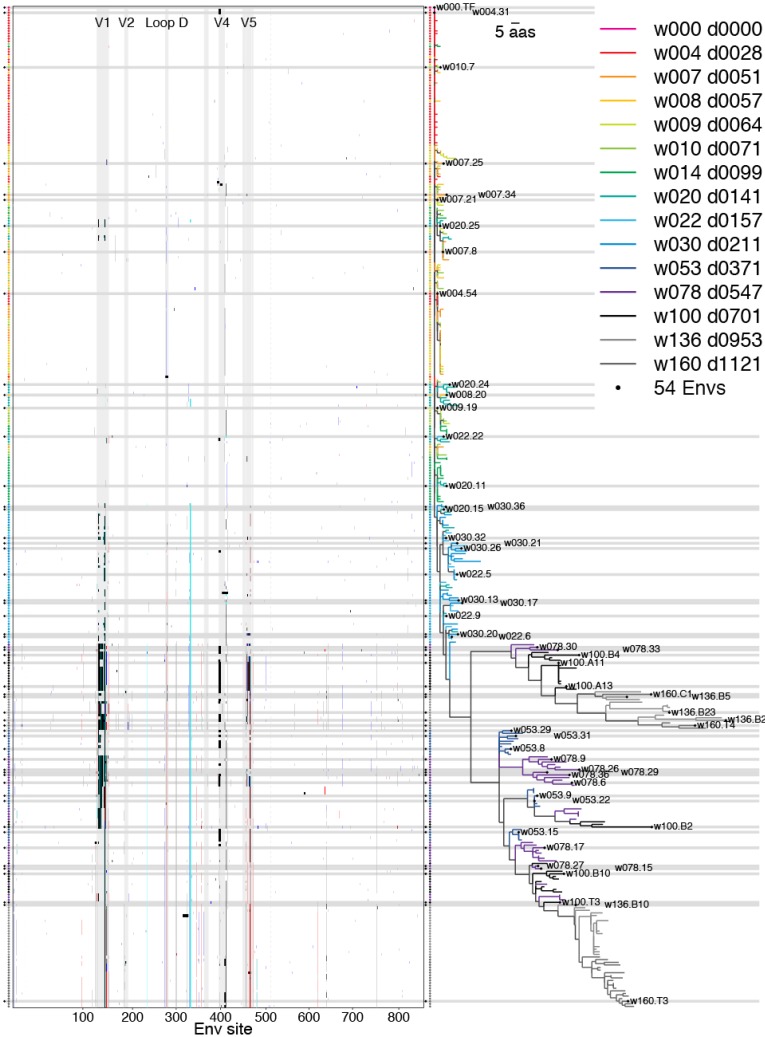
Figure 7.
Env variants in phylogenetic context. A pixel plot is paired with the maximum-likelihood phylogeny, such that each row depicts one of 385 Envs sequenced by limiting-dilution PCR. The top row corresponds to the TF virus. In the pixel plot (left), sites that match the TF are blank and mutations are shaded indicate gain of negatively (red) or positively charged amino acids (blue), addition of an N-linked glycosylation motif (cyan), indels (black), or other mutations (grey). The colored vertical stripes that emerge with time correspond roughly to TF loss. Env landmarks appear as vertical bands throughout the pixel plot (light grey), and dashed line delineates the boundary between gp120 and gp41. Tree branches and symbols are color-coded to indicate sample time-point, and the 54 selected Envs are marked by a black circle and horizontal bar. HXB2 numbering is used here and throughout, beginning with the Env signal peptide start codon in column one and ending with the stop codon at position 857. This visualization was produced by the pixelgram package; see Section 4.4 for availability.

