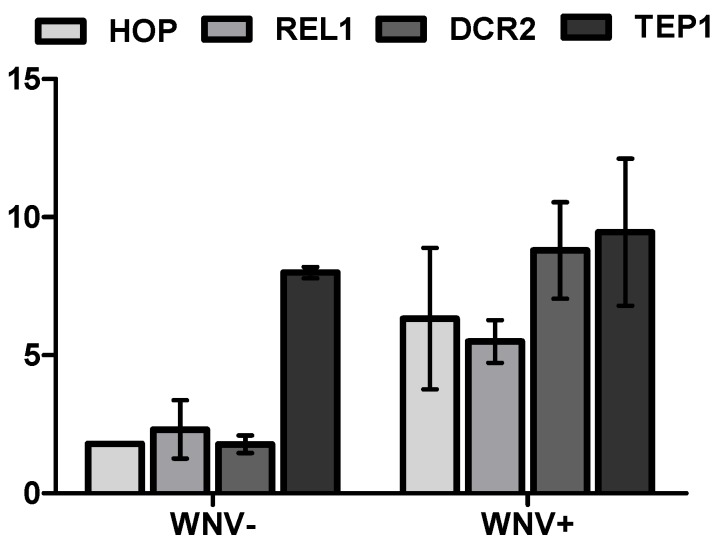
Figure 4.
Cx. pipiens immune gene transcript levels at seven days post blood feeding for WNV+ and WNV− mosquitoes. Differences are expressed as mean fold change in qPCR CT (cycle threshold) +/− SD relative to unexposed mosquitoes and normalized by rpl8 transcript levels (ΔΔCT). Statistically significant differences (t-test, p < 0.001) were measured for all transcript levels for WNV exposed (− or +) relative to unexposed mosquitoes and WNV− relative to WNV+ mosquitoes, with the exception of TEP1, for which WNV− and WNV+ groups were statistically equivalent (p = 0.099).

