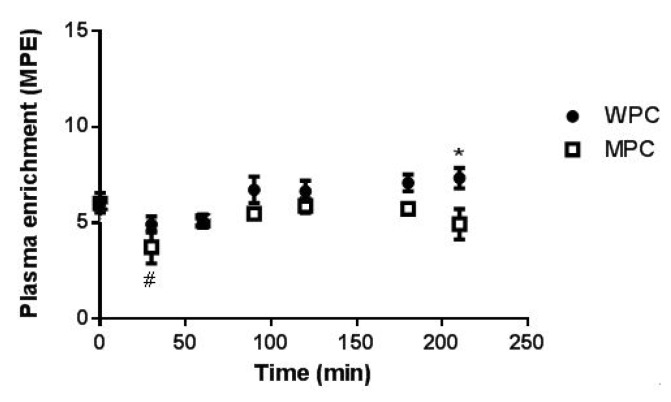
Figure 4.
Plasma 13C6 enrichment. The tracer enrichment of 13C6 phenylalanine over the infusion period is shown. The closed circles represent WPC and the open square represent MPC. *, different from MPC at the same time point p ≤ 0.05; #, main effect for difference from 0 time point p ≤ 0.05. Error bars represent standard error of the mean.

